Basic Usage
Once humanlog is installed, it's time to put some data in there. Humanlog has first class support for:
- line-oriented log data, particularly for structured JSON/logfmt data
- OpenTelemetry tracing data
Ingest
Ingesting Logs
Ingesting logs in humanlog is straightforward. Simply pipe them into the CLI or feed them to the CLI's stdin.
Run your app or service with humanlog on its output:
my_app | humanlog
Or feed your file to humanlog:
humanlog < your_log_file
Your logs will appear prettified and will be ingested into the localhost engine. You can then query them.
If you just want to ingest the logs without prettifying them, use:
# ingest logs from an app, without printing them
my_app | humanlog ingest

# ingest logs from a file, without printing them
humanlog ingest < your_log_file
Ingesting OpenTelemetry (tracing, more to come)
Ingesting OpenTelemetry works out of the box with no need to do anything special in most cases.
When humanlog is running, it listens on ports 4317 and 4318 for the OpenTelemetry protocol (OTLP). Simply start your service with the default OpenTelemetry configuration, and everything will work automatically without any additional setup.
You can monitor your spans either being streamed into humanlog with:
humanlog stream 'spans | filter true'
Tracing can produce a lot of data. Visualizing a stream of all spans being emitted in real time can tax your browser.
If your app needs to be told where to export the OpenTelemetry data, here are commonly used values. Note that the default usually do not need to be specified:
| Situation | OTEL_EXPORTER_OTLP_ENDPOINT |
|---|---|
| Default (same host, OTLP/HTTP) | http://localhost:4317 |
| Default (same host, OTLP/gRPC) | http://localhost:4318 |
Docker, Orbstack, kind (OTLP/HTTP) | http://host.docker.internal:4317 |
Docker, Orbstack, kind (OTLP/gRPC) | http://host.docker.internal:4318 |
The host.docker.internal hostname enables programs running inside virtualized container runtimes (such as Docker Desktop on Mac, OrbStack, Rancher Desktop, or Podman) to communicate with services on your host machine. If you're wondering which container solution to use, we recommend Orbstack.
Working With Your Data
Querying data in humanlog is done using the Humanlog Query Language. You can learn all the details about it in the reference documentation.
There are two types of query: historical and stream queries. The Query tab lets you query historical data (anything that has been ingested), while the Stream tab lets you work on a stream of data as it is being received by humanlog. The query language is the same for both, but some features available in the historical mode are not possible in stream mode, simply due to the nature of stream data.
By default, when we talk about querying, we mean querying data that has been ingested and stored in humanlog. We use the term stream queries whenever we're referring to queries that are open-ended.
The result of a normal query is static. This means that a normal query runs against the data that exists at the time the query is initiated and returns only the matching data. Data that arrives afterward is not included in the result set. In contrast, stream queries run against incoming data, row by row, event by event, in real time.
Query
You can run queries against point-in-time (historical) data in two ways:
Via the CLI:
humanlog query 'filter request_id == "2937400f-b5c5-426f-b07a-4c7723ff6740"'
Which will open the UI with a view on this query... or directly via the UI:
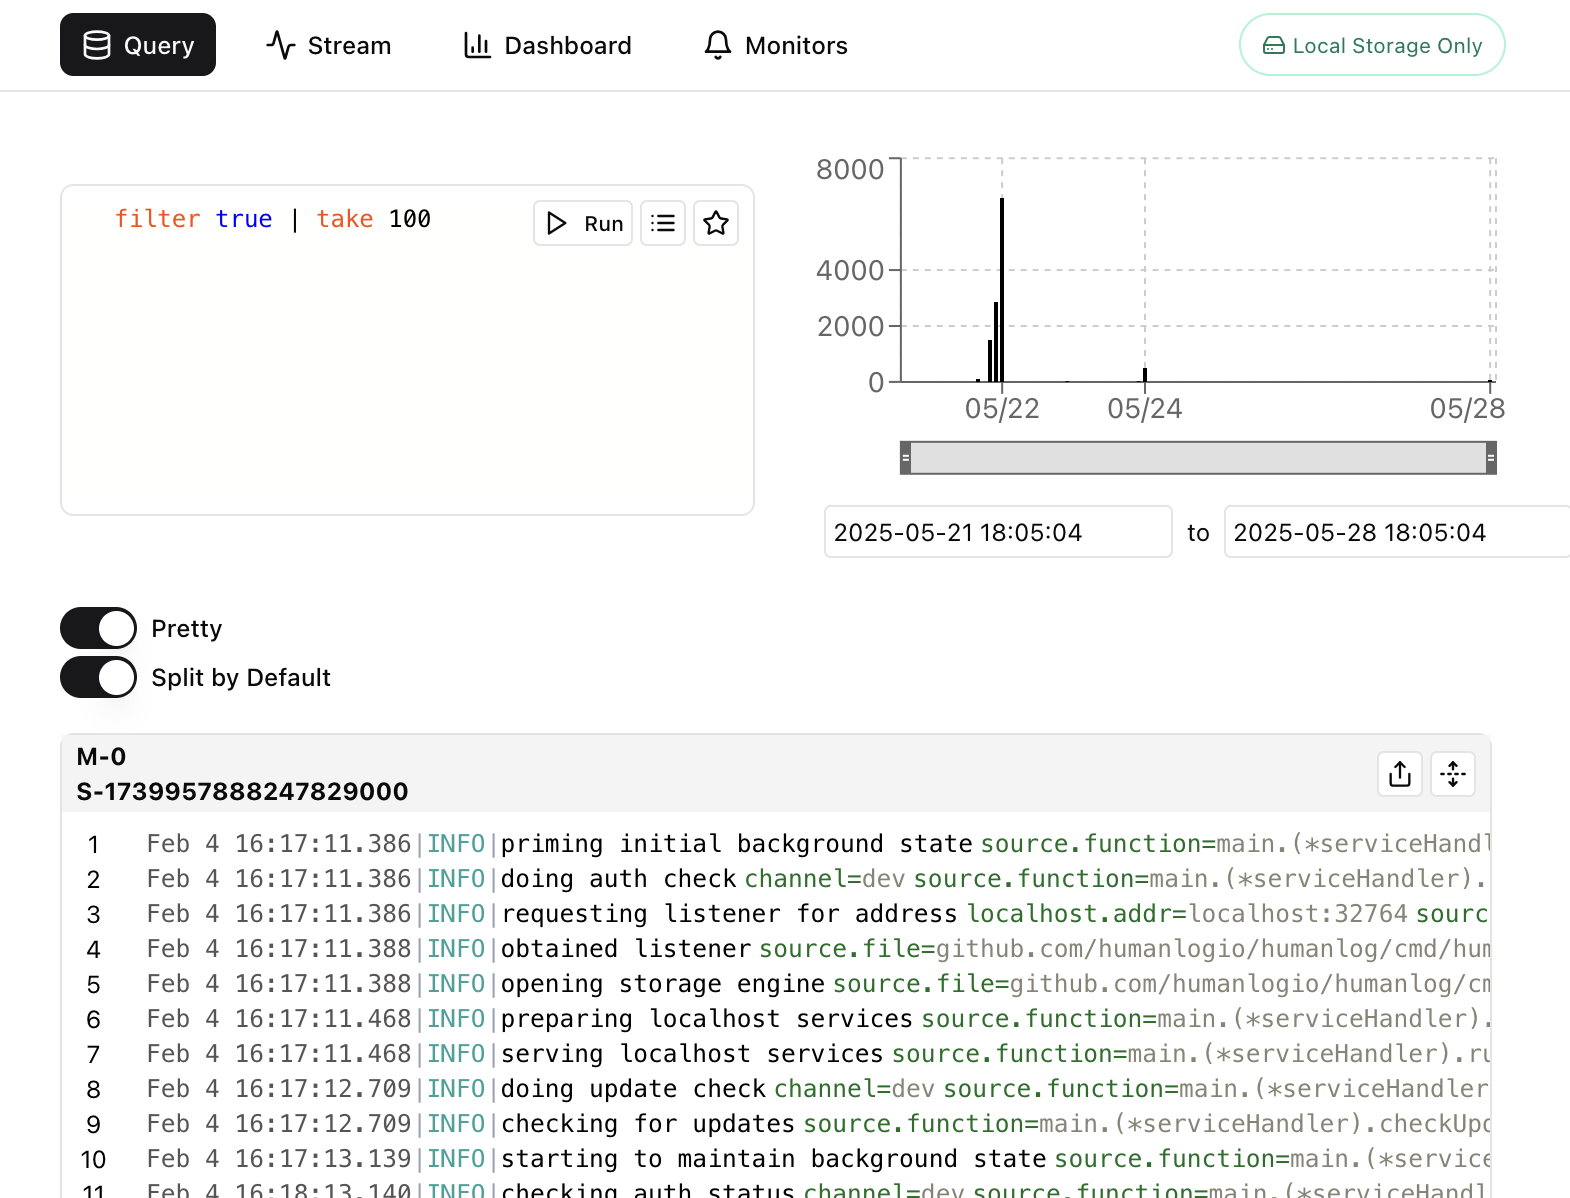
You can read and learn more about queries here.
Stream
You can run stream queries in two ways:
Via the CLI:
humanlog stream 'filter body == "something in the future that i'm looking forward to"'
Which will open the UI with a view on this stream of data... or directly via the UI:
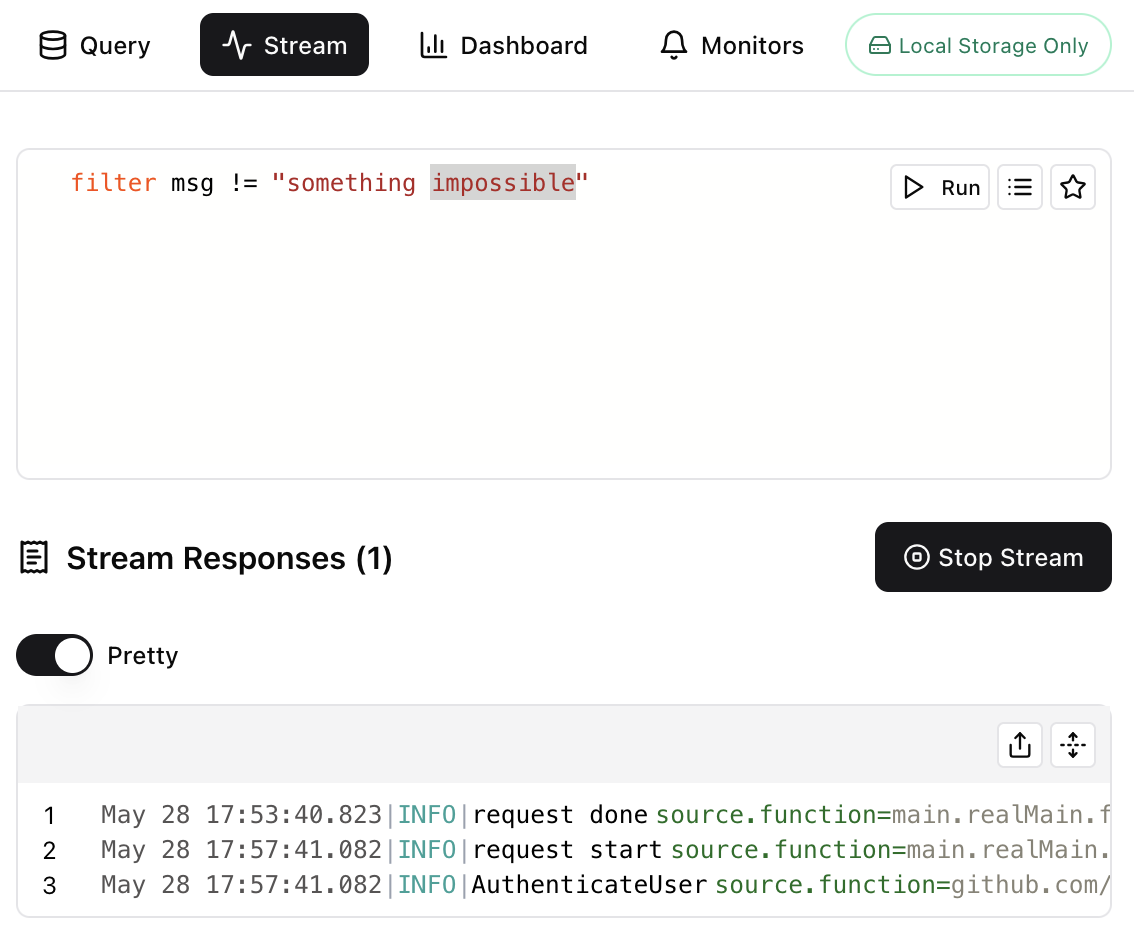
You can read and learn more about streams here.
Sharing Your Work
You can share the results of your queries in public or in private. This is a great way to share your findings with friends and colleagues, so they can see the insights you gathered during your investigations. Here's an example public share.
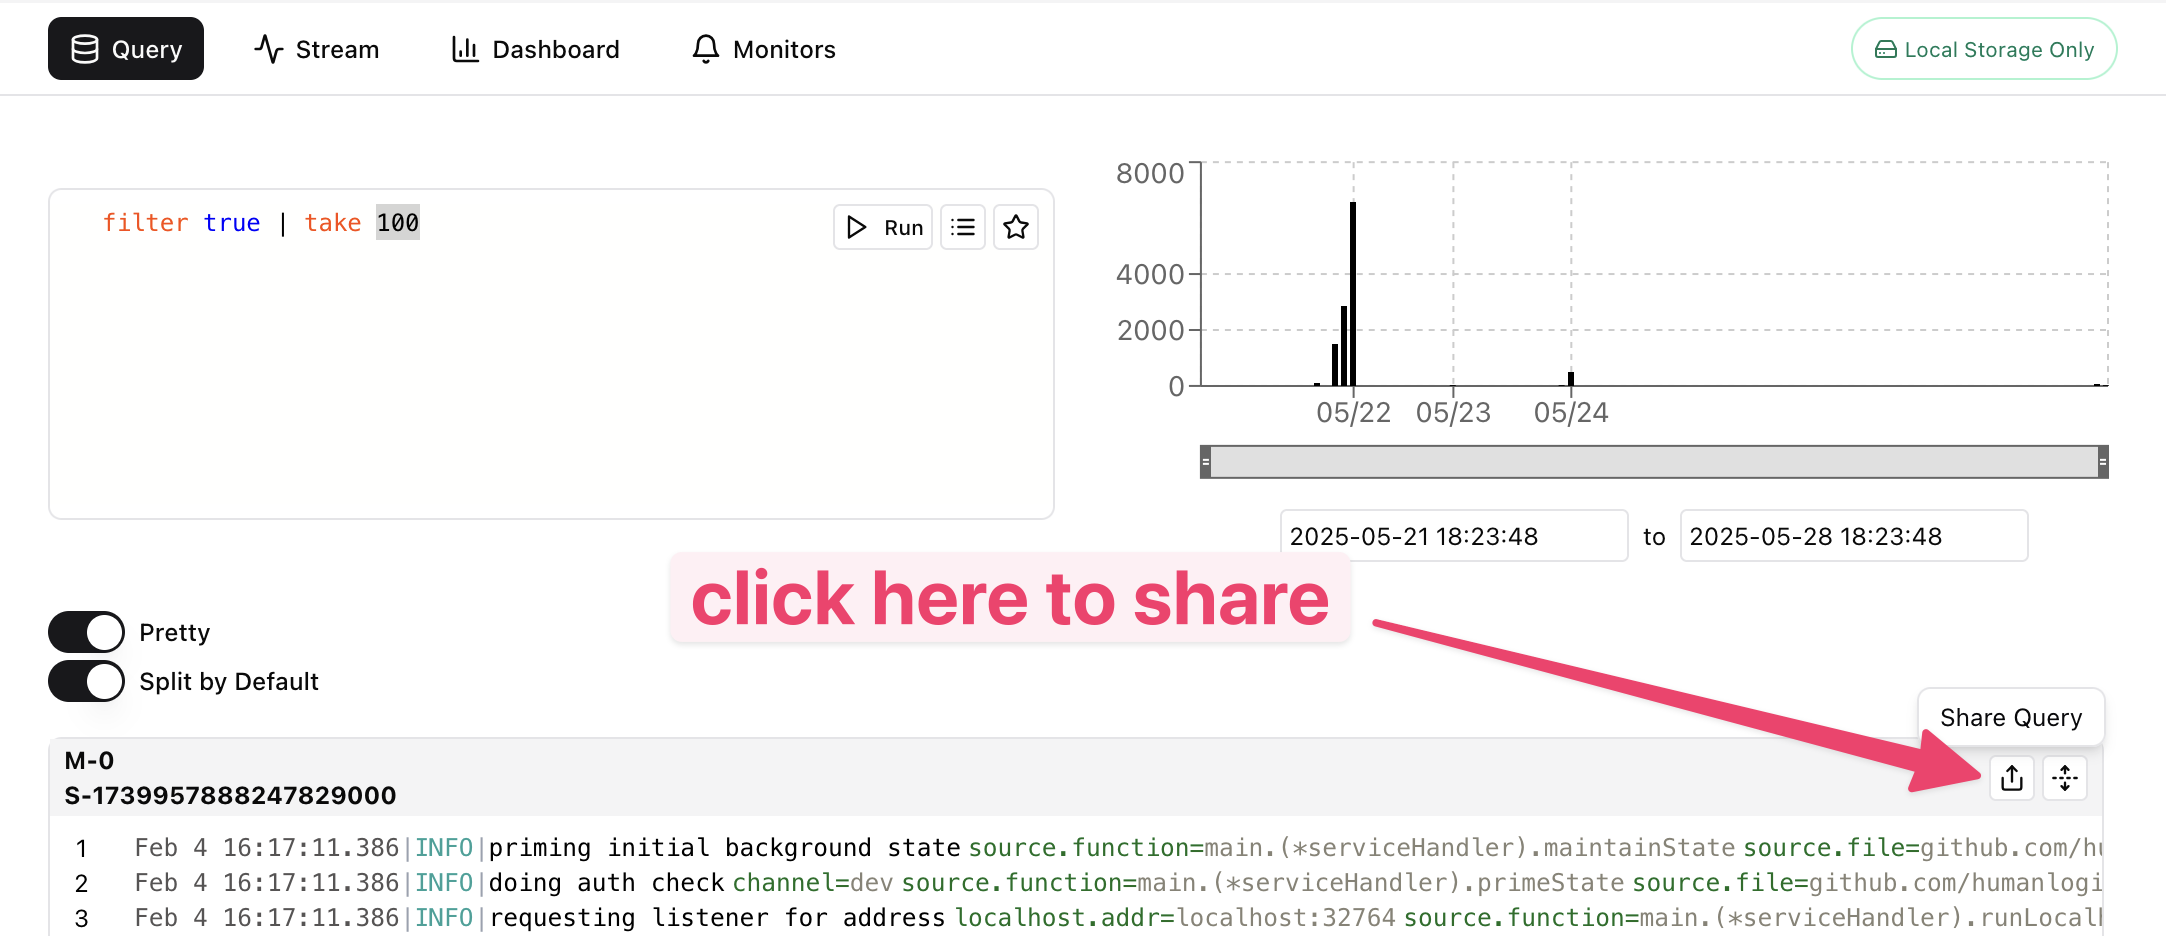
Sharing results is easy. Simply click on the share button next to a data panel:
This will open a modal that asks you to choose a privacy setting:
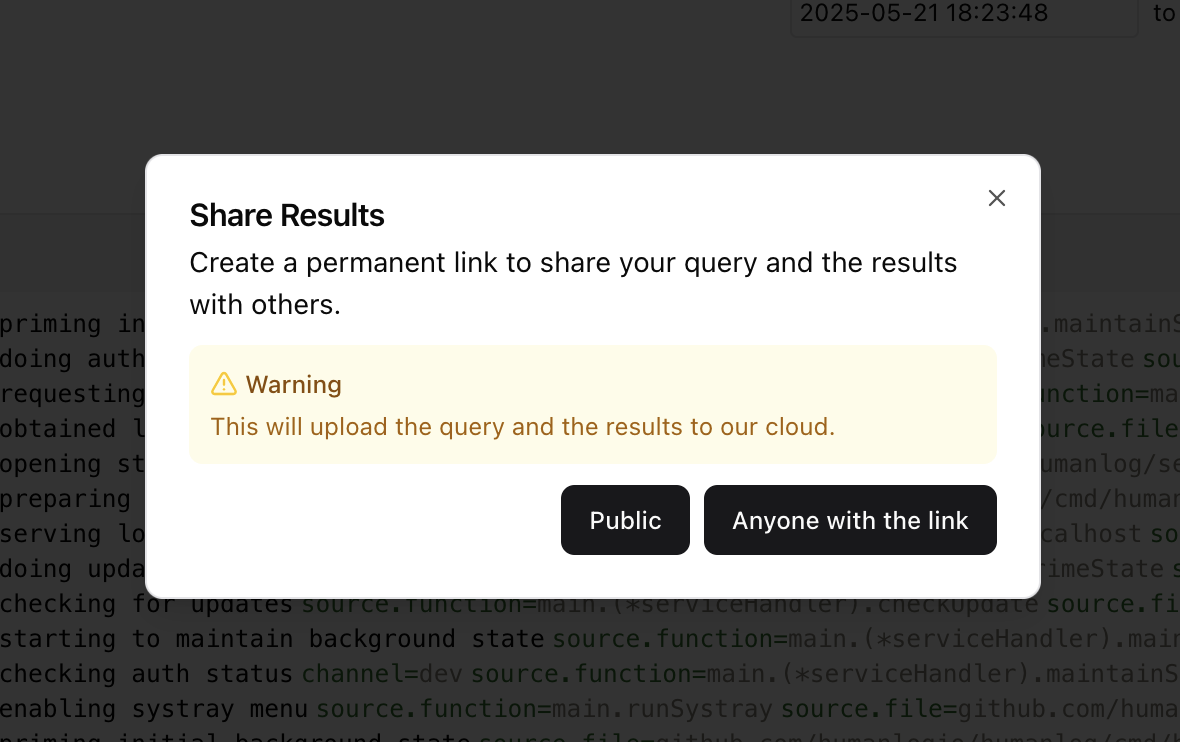
Clicking on either option will produce a link that you can share:
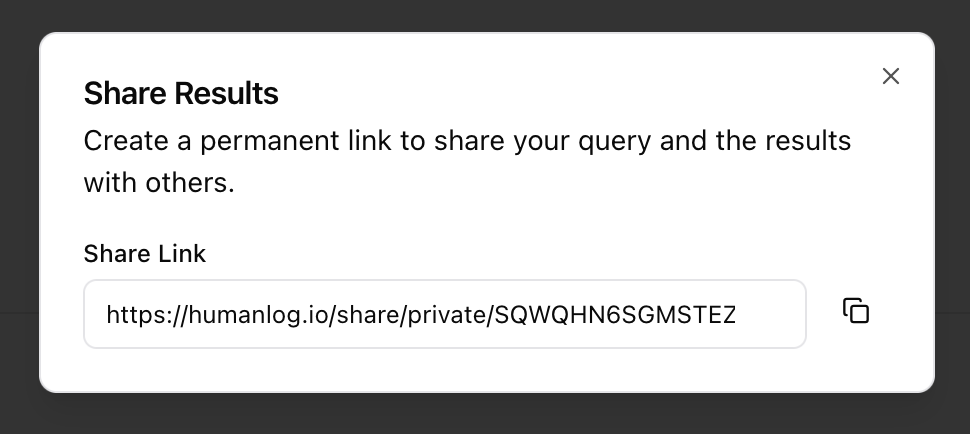
These links will render your query and the associated results:
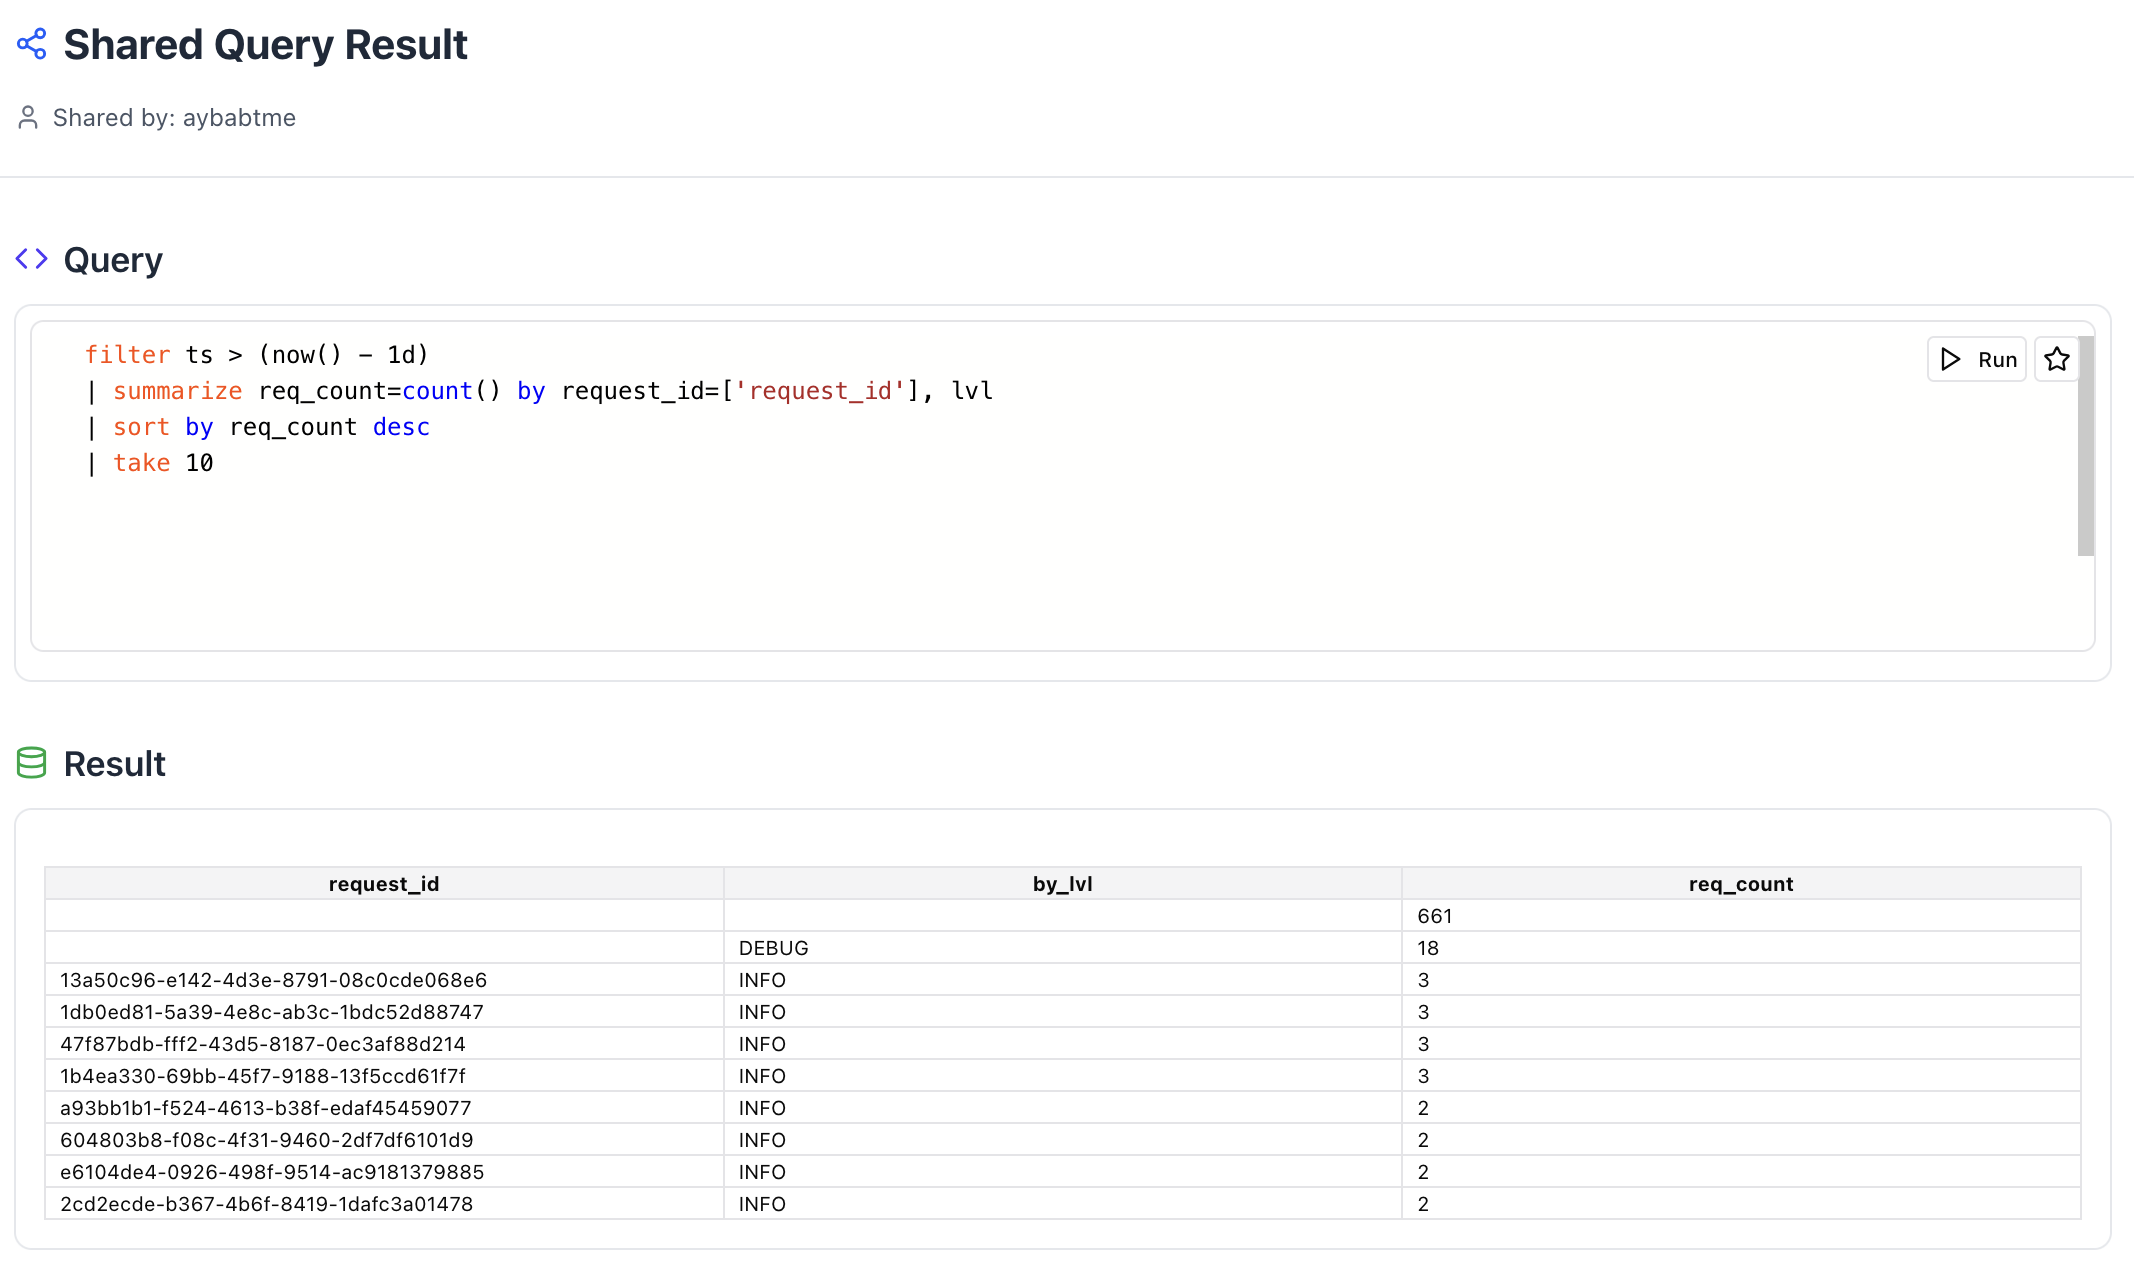
- Public shares are like public GitHub Gists, others can see them on your profile page.
- Private shares are like private GitHub Gists, anyone with the link can see them, but they do not show up on your profile page.
You can read and learn more about sharing here. Note that using the share feature involves sending your data to our cloud for archival. Exercise caution regarding what data you choose to share, especially when dealing with sensitive information.
Prettifying logs
You can use humanlog simply to prettify unwieldy JSON or logfmt logs. Just pass these logs into the CLI via stdin and they'll be transformed into a more readable format.
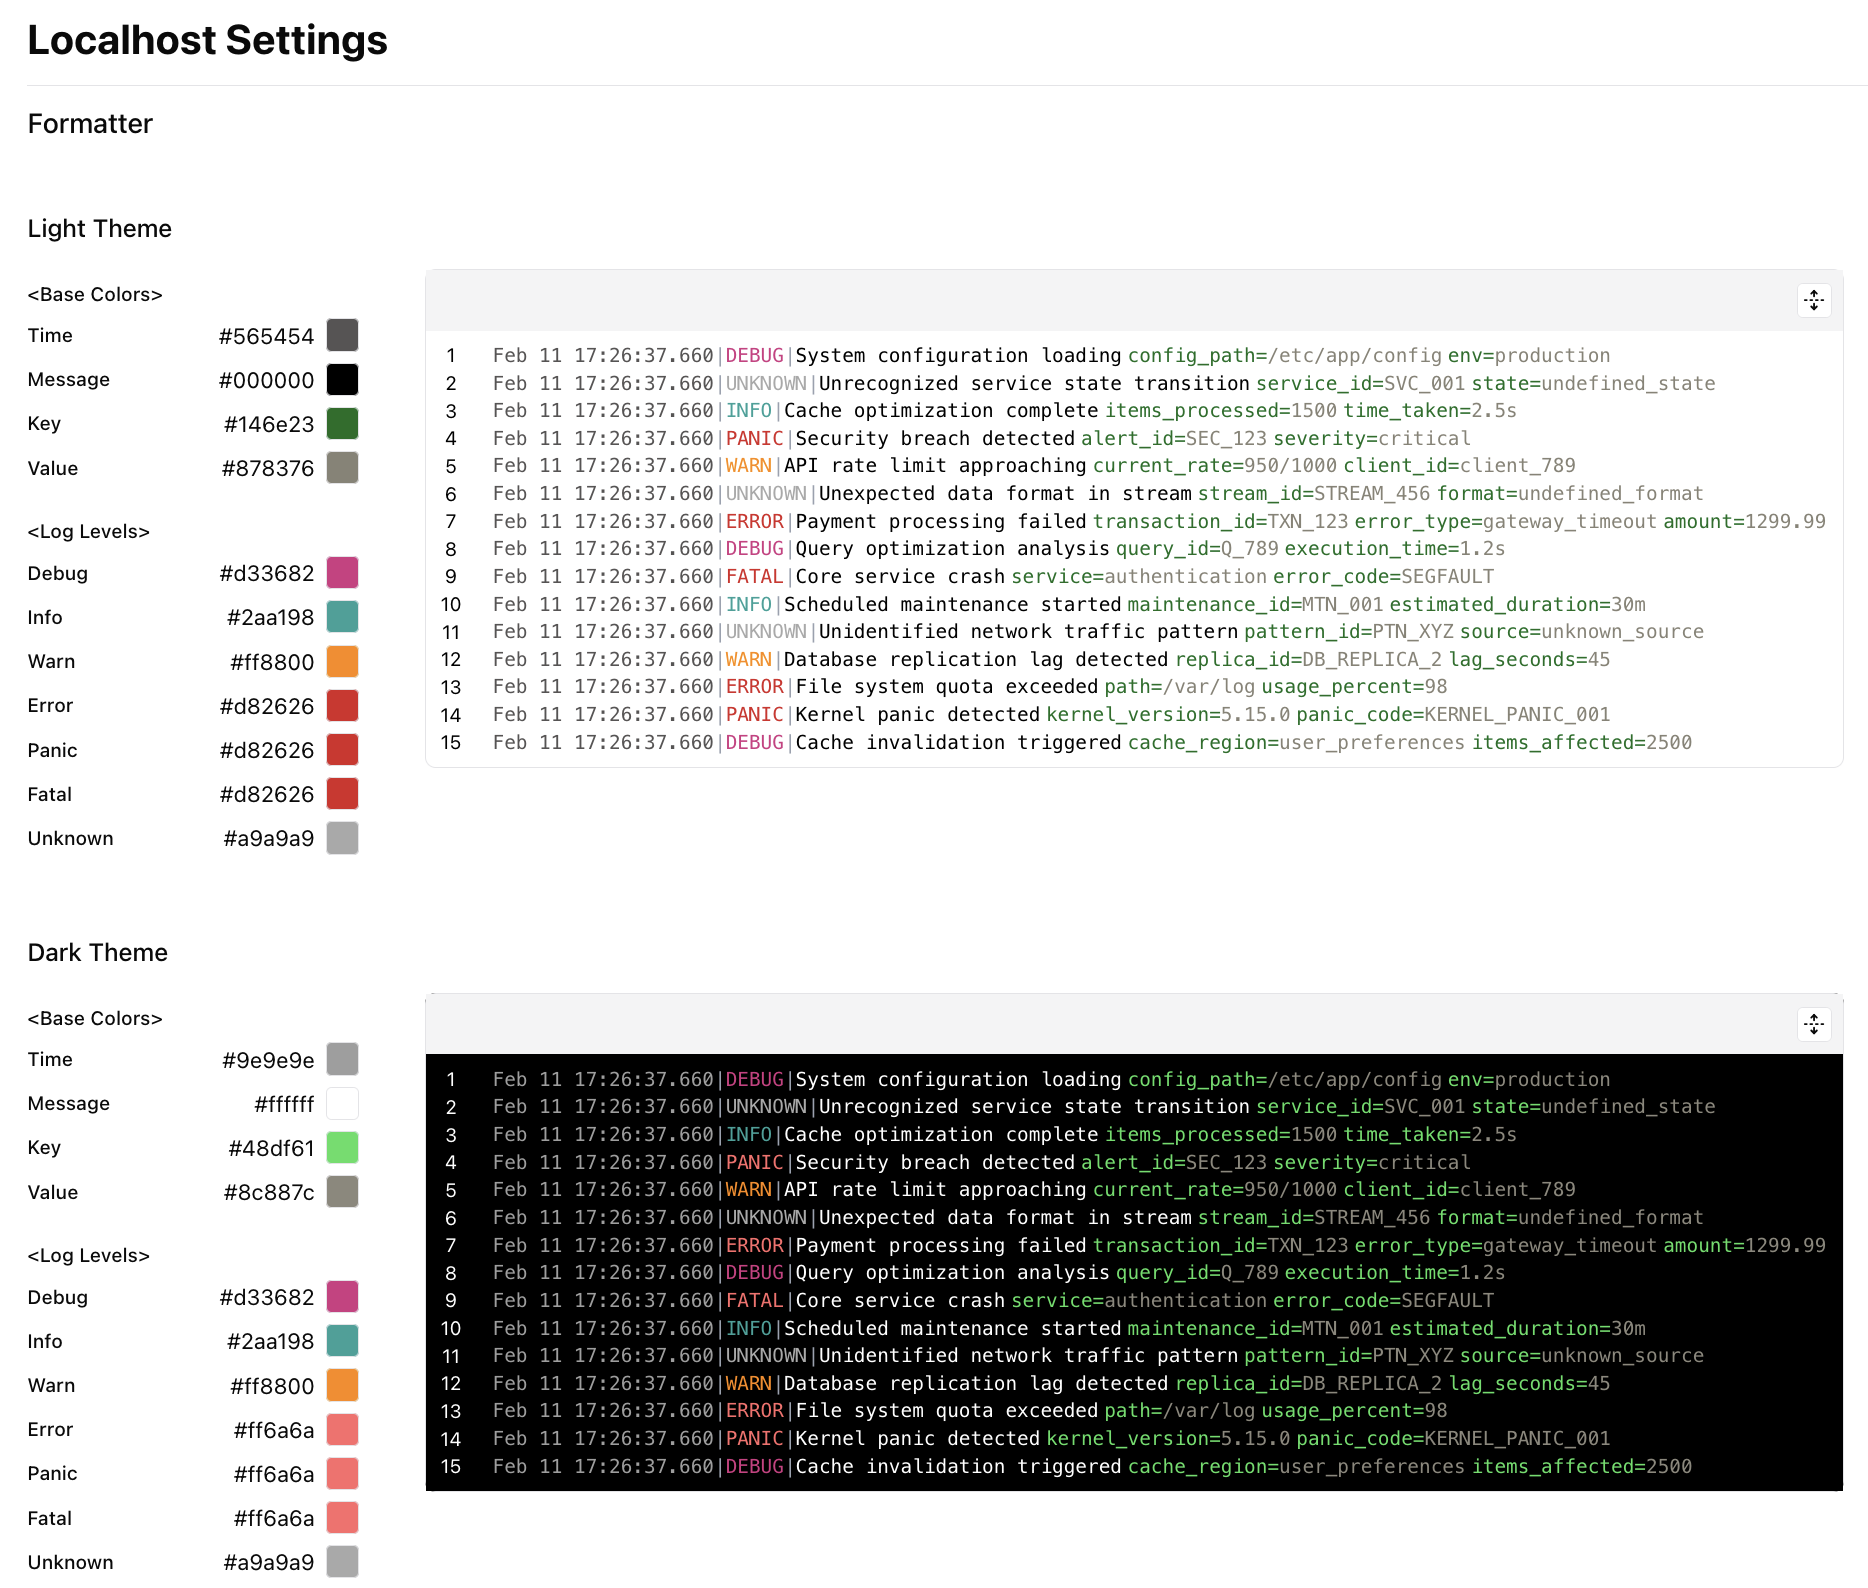
Color Themes
You can change the default themes used by both the UI and the CLI in your settings.
Coming soon:
- Saving color themes by name.
- Sharing themes with others.
- Using named themes from a library.
You can read and learn more about themes here.
What's Next?
Need help or want to give feedback? Join our community channels.