Querying Your Data
Humanlog features a powerful query engine that allows you to query your data in a declarative manner. The language is called Humanlog Query Language. It's a pipeline-based language where you define a series of operations to apply to your data. Read the reference for detailed information, or continue reading here for a high-level overview of how the query feature works with example usages.
Basic Usage
You can run queries in two ways: via the CLI or the UI.
Querying Via the UI
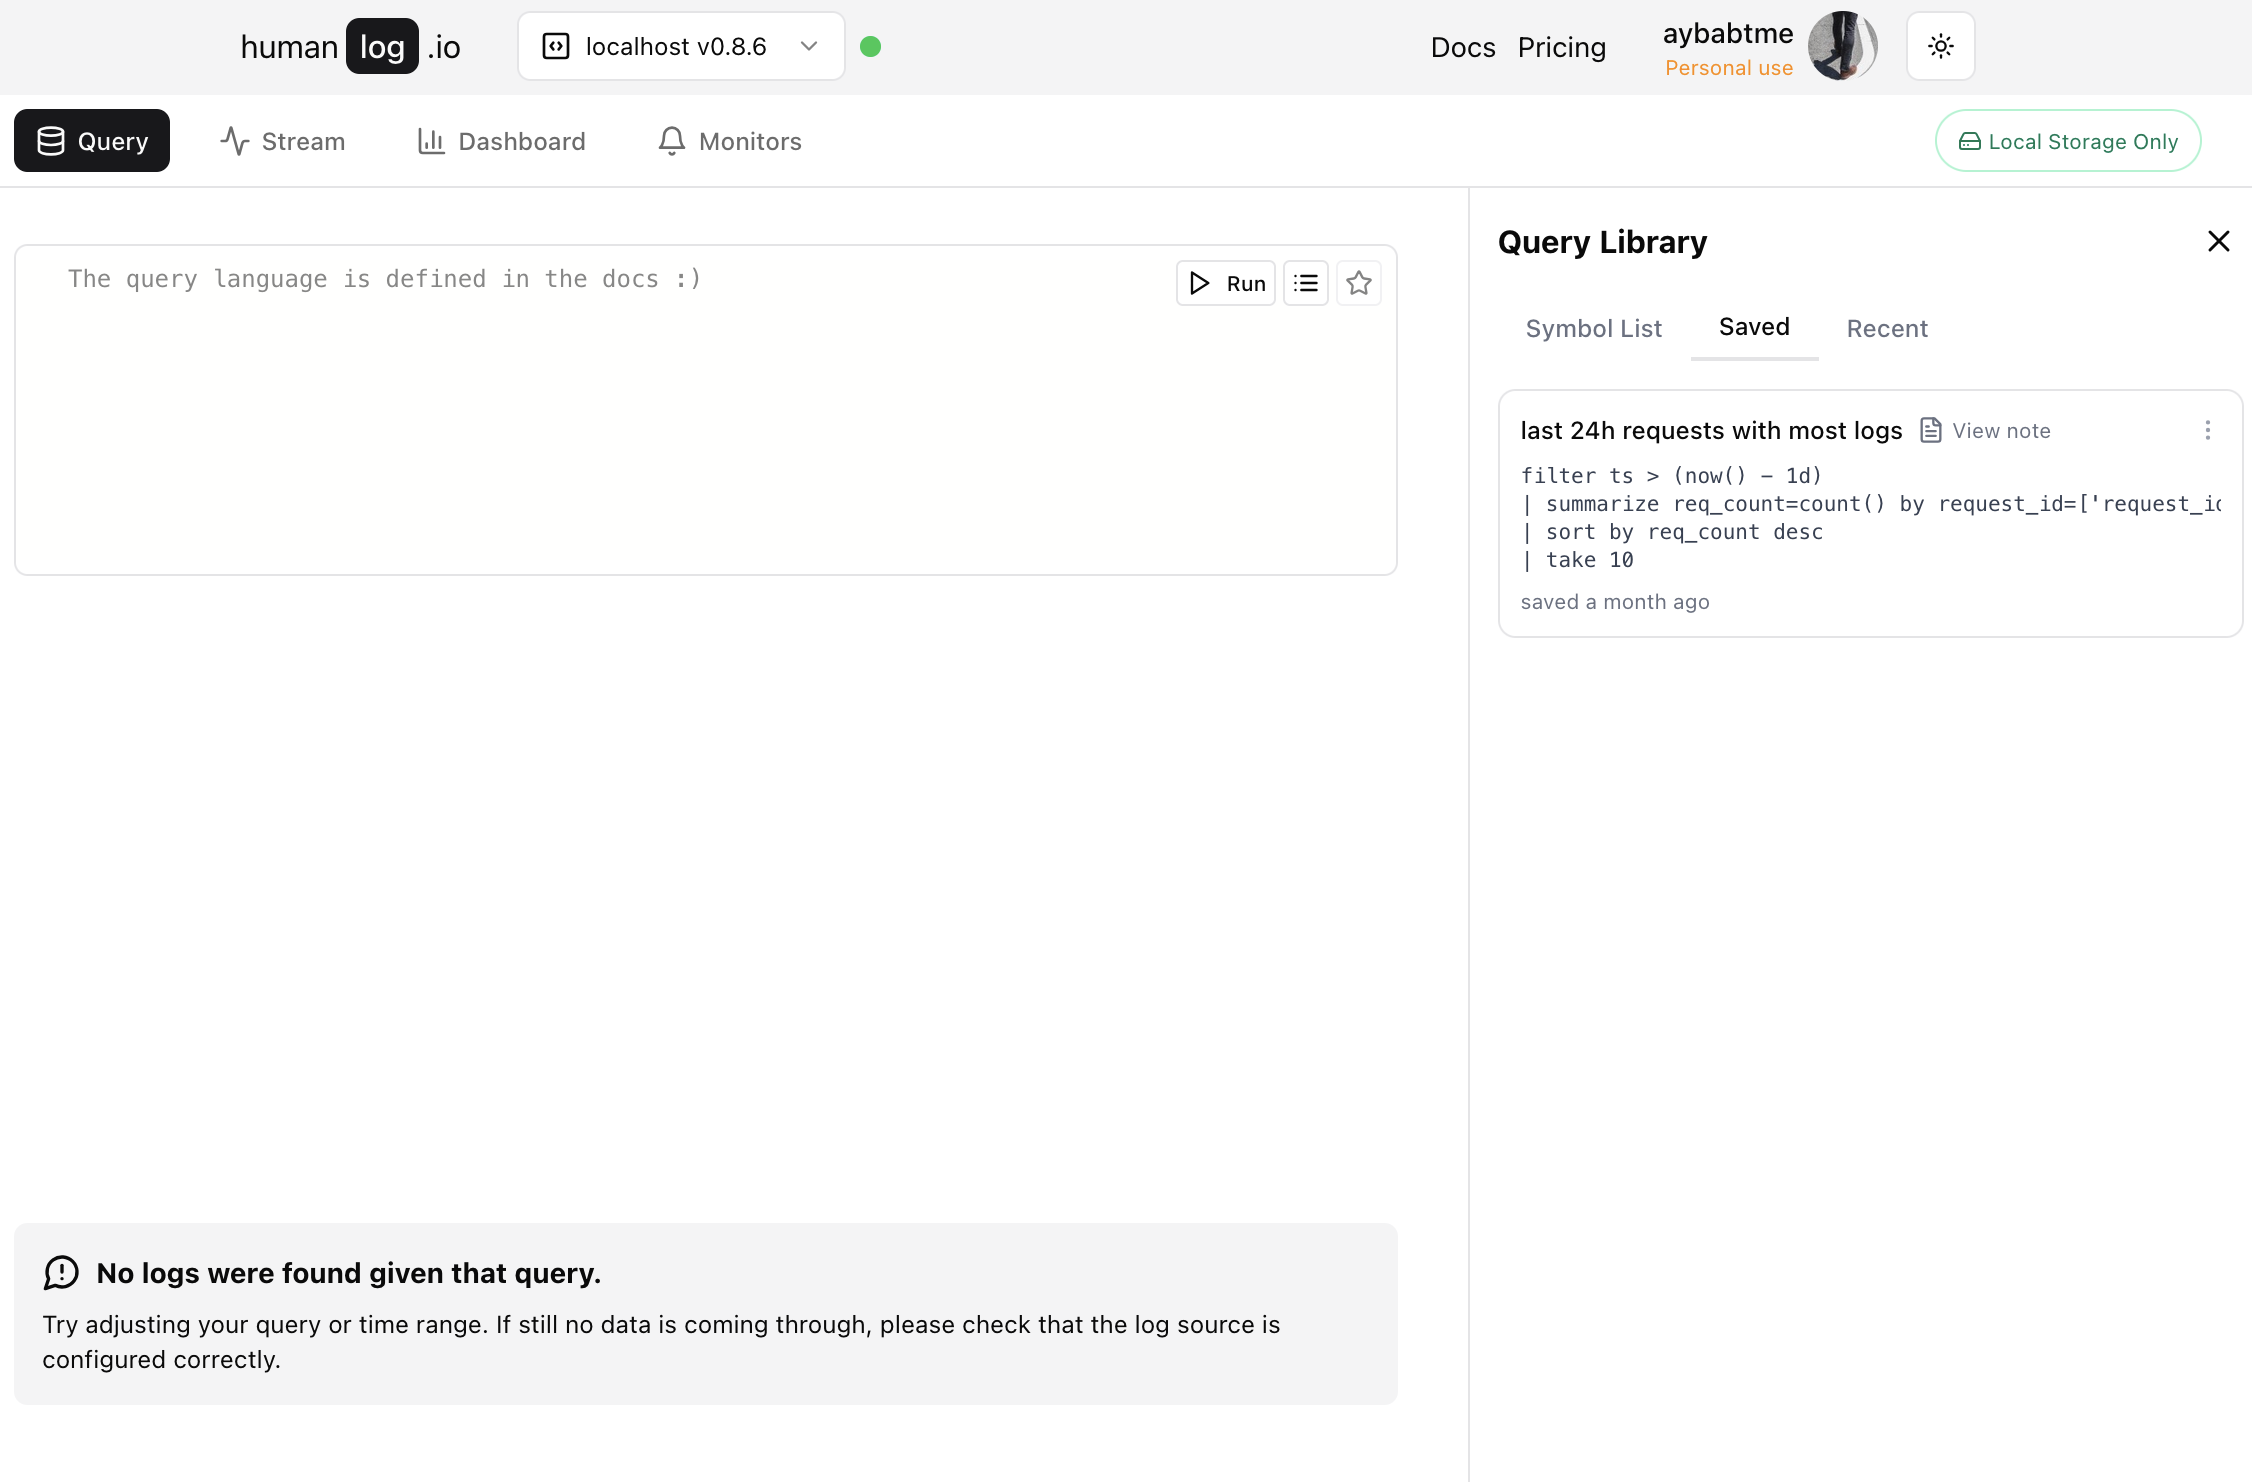
If Humanlog is running on your machine, a green dot will be visible next to the datasource selection dropdown on the website.
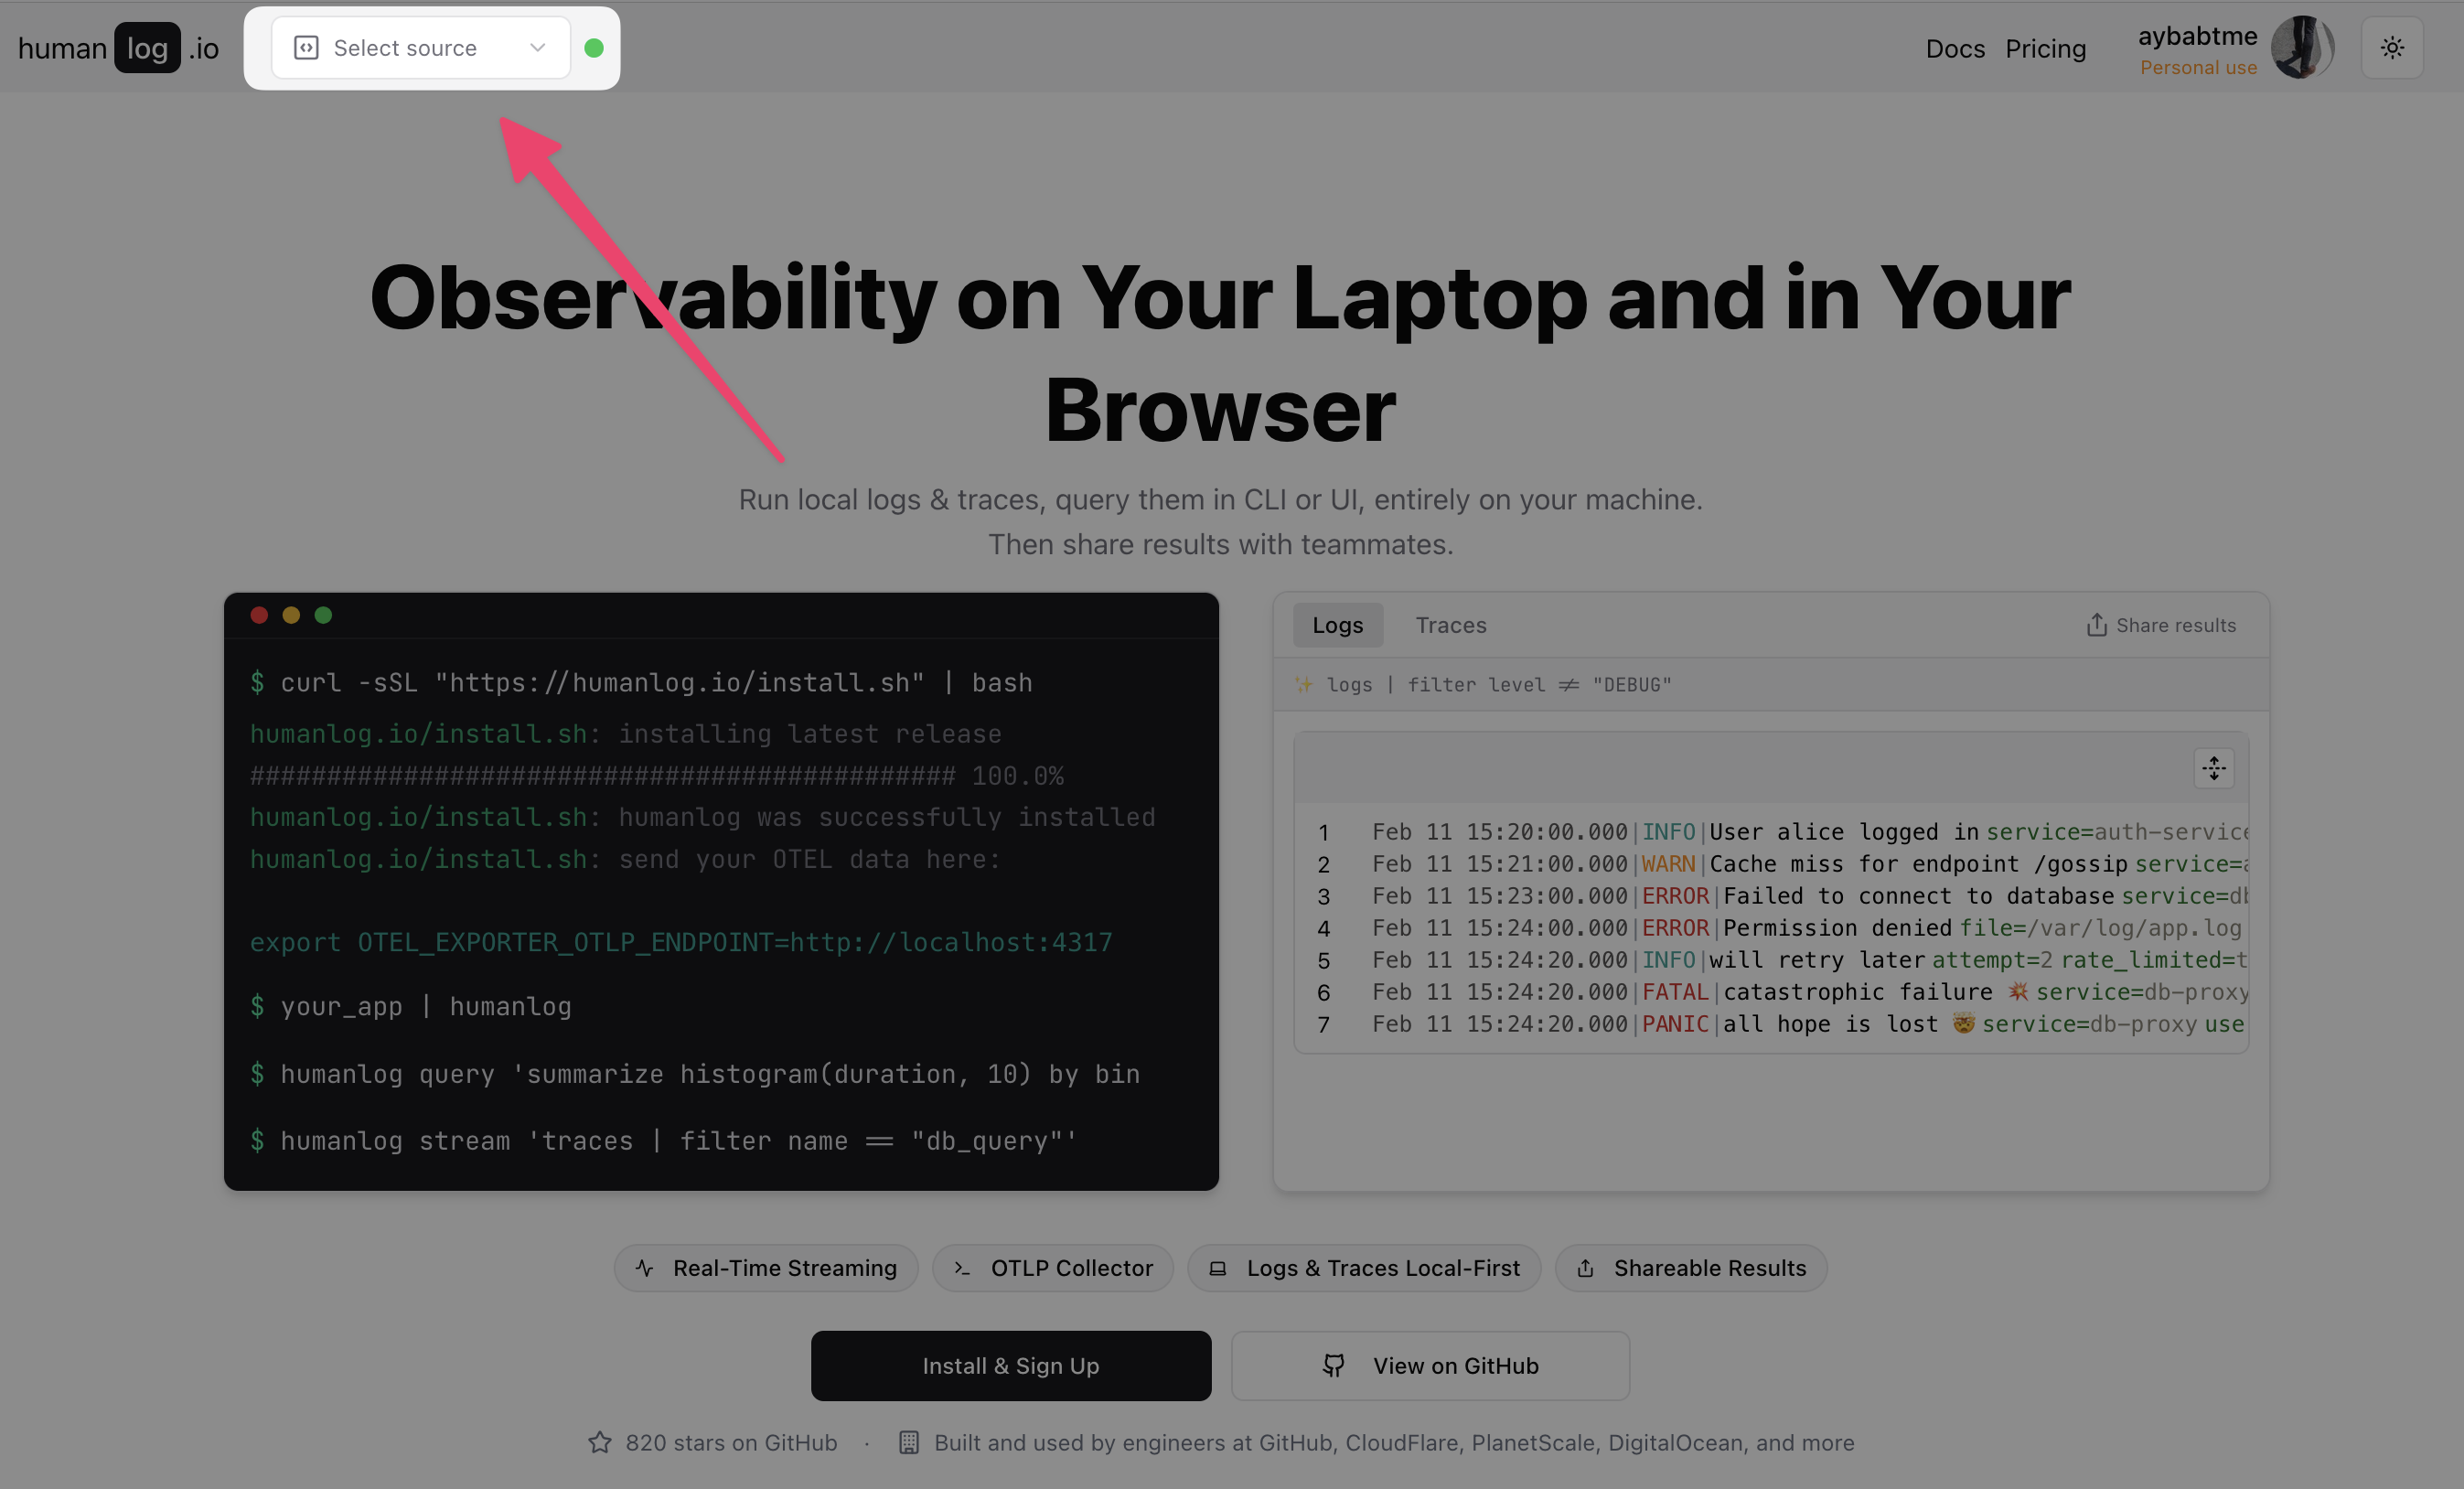
Selecting it will open the query page for this data source.

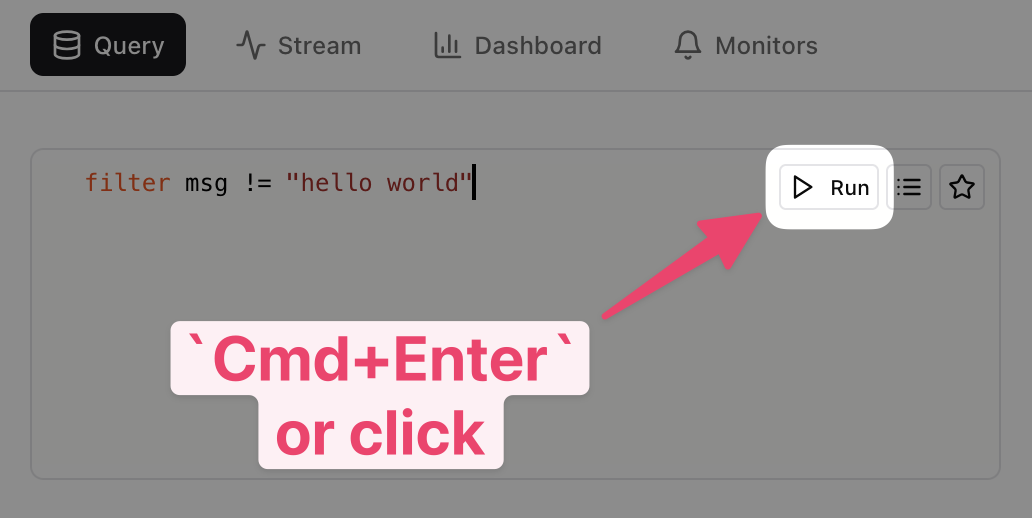
The query tab is empty by default.
To execute a query, first write a query in the query editor area and then either press Cmd+Enter or click the "Run" button.
Otherwise, you can navigate to the localhost query page directly at
localhost/query.
Querying Via the CLI
Querying via the CLI primarily serves as a convenient way to open the UI with a query already set up.
humanlog query 'filter true | take 10'
This will open the UI, execute the specified query, and display its result.
Query Editor Area
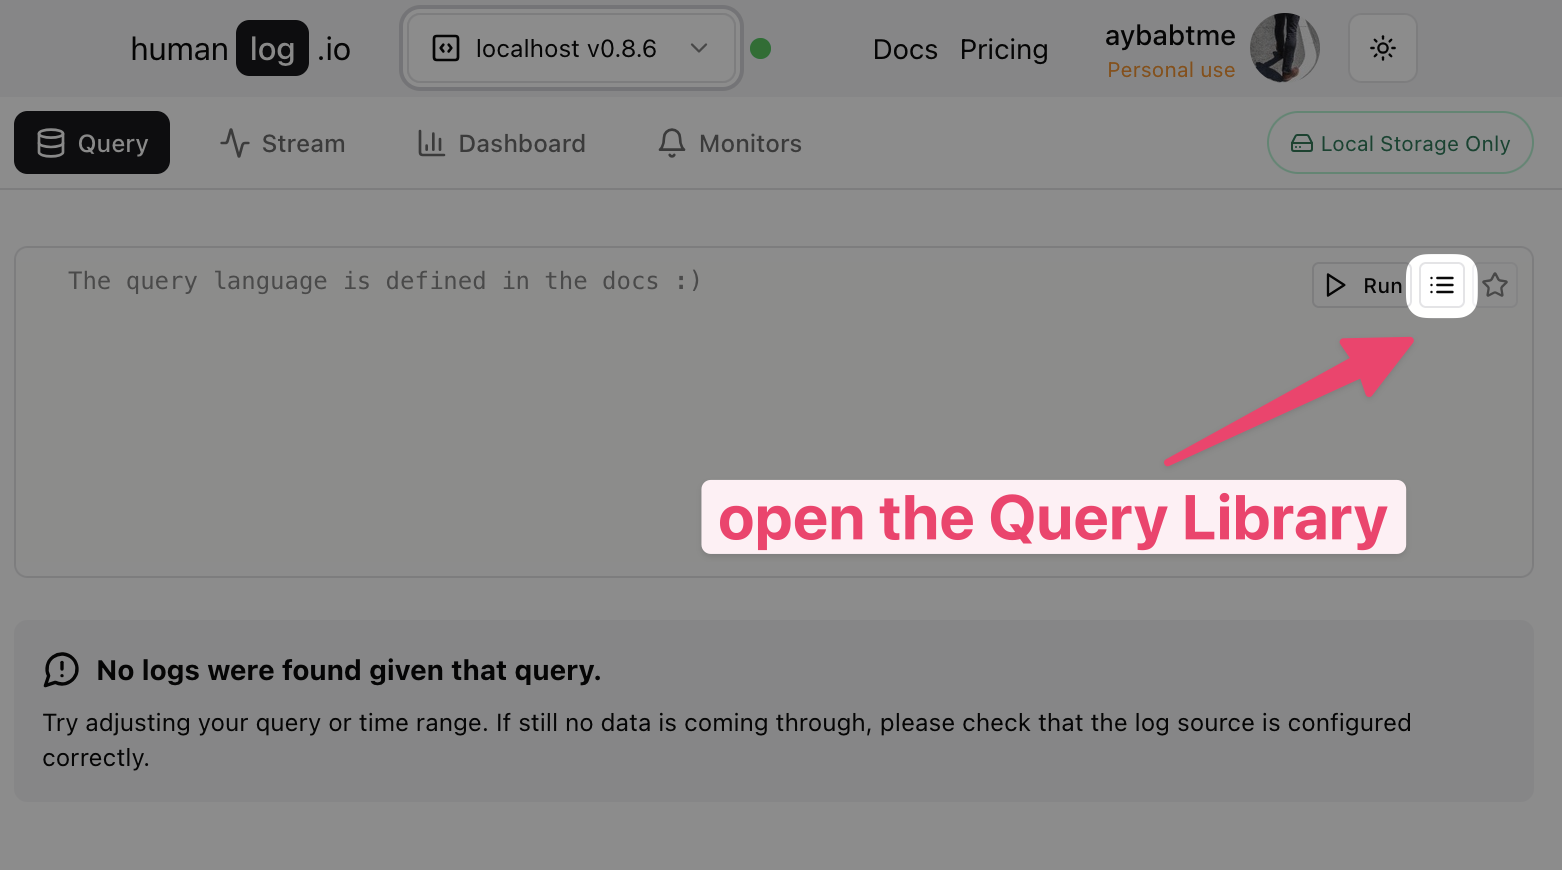
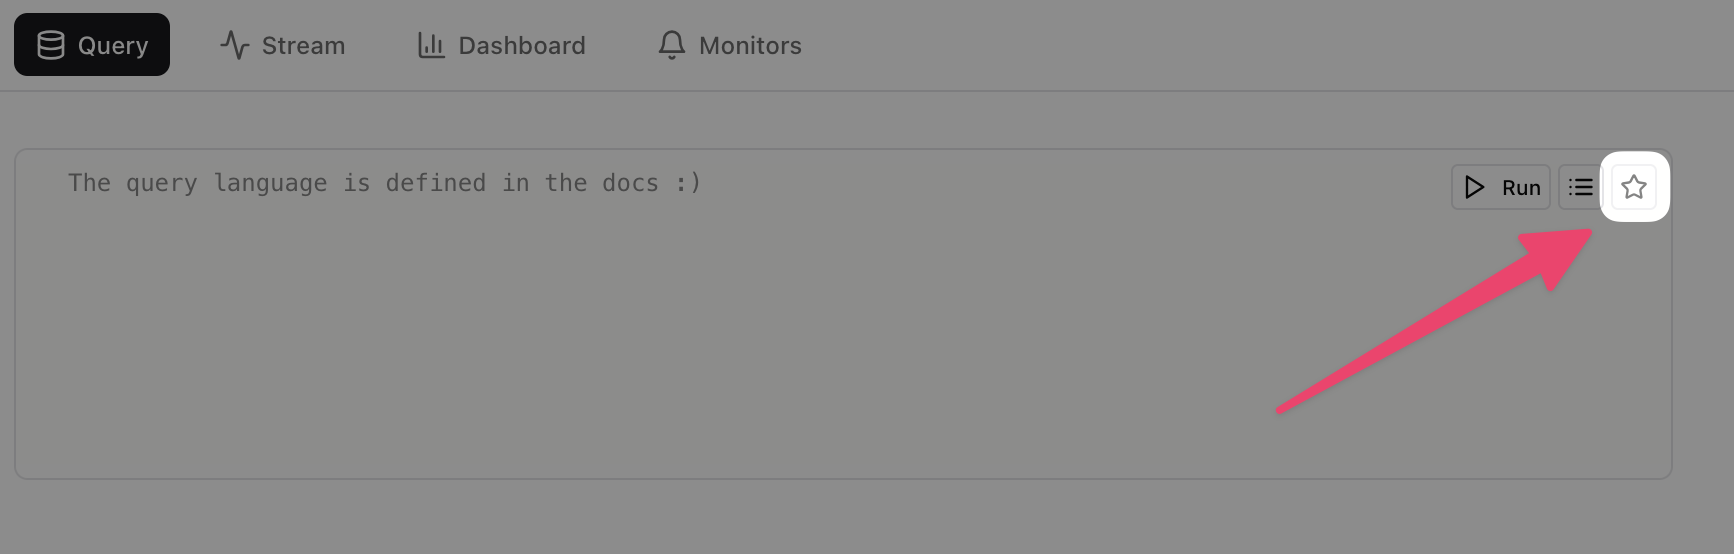
The query editor area lets you write your queries. Along with a space to write your query, you can click on the "Run" button to execute it, the query library button to open the query library sidebar, or the save button to save your query.
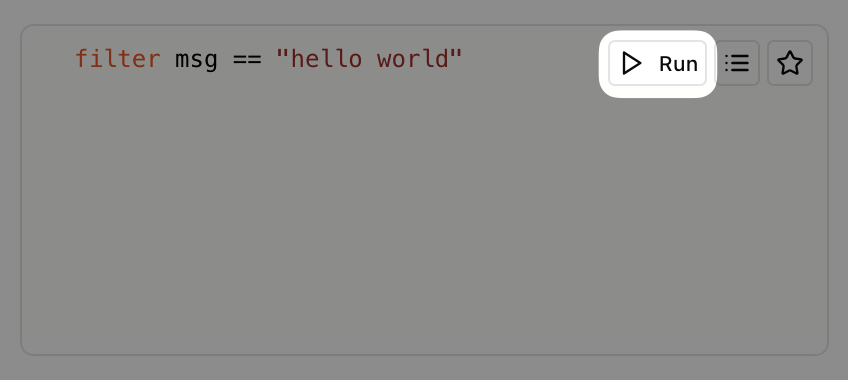
Run the query
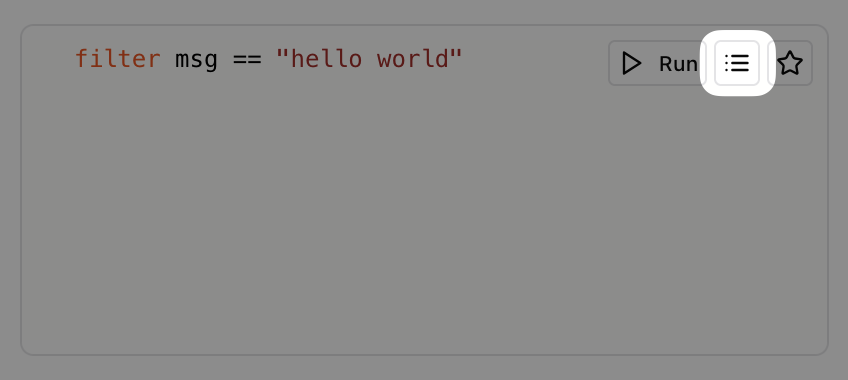
Open the query library nav bar to see the symbols in scope, your saved queries and your recent query history.
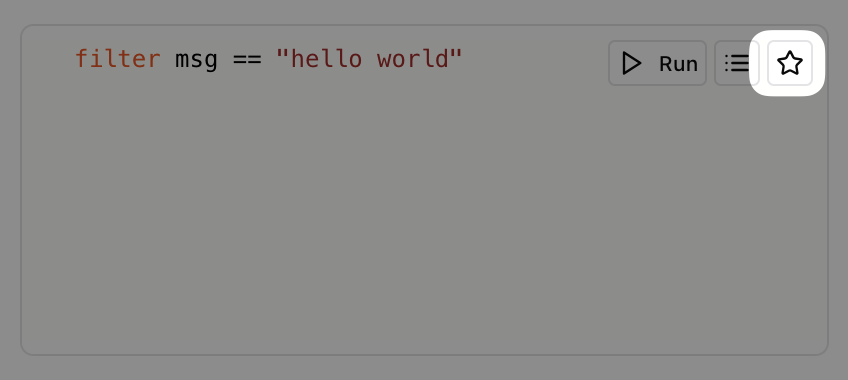
Save the query for later use.
Discovering Symbols In Scope
Open the query library nav bar to see the symbols in scope.
The list of symbols shown in the Symbols List tab represents key-values that are found in your data set.
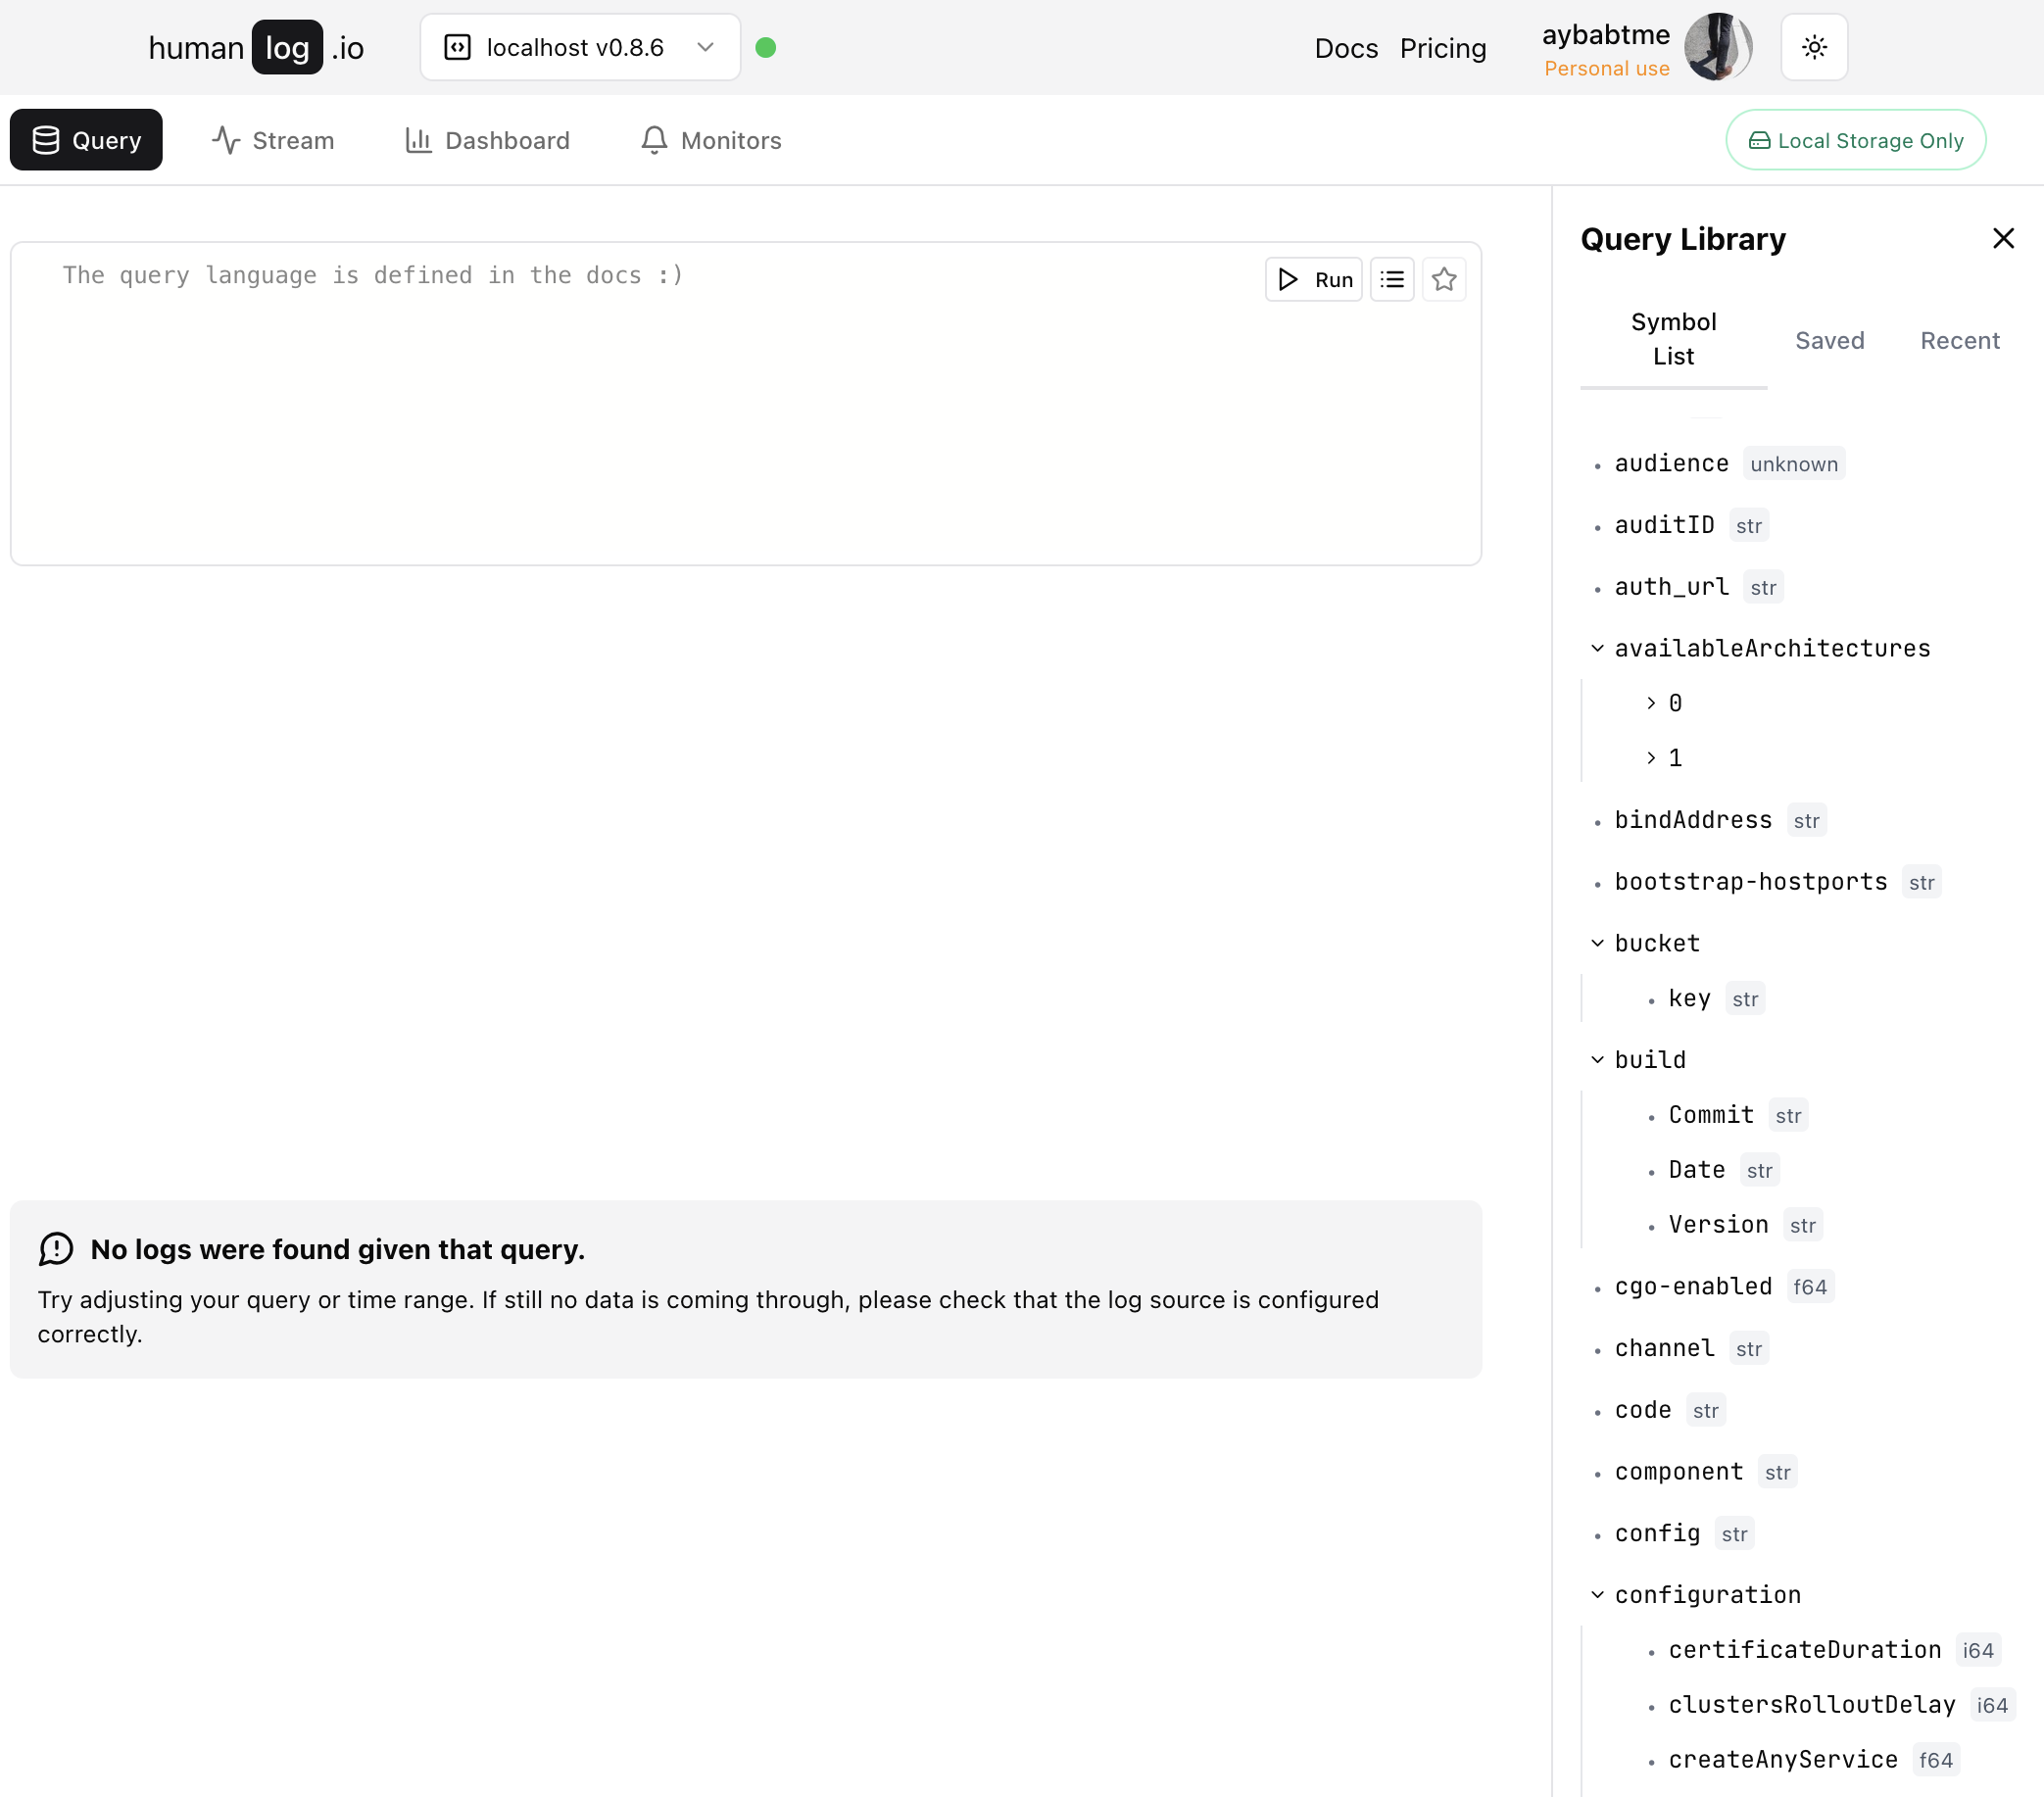
You can click on a symbol to add it to your query.
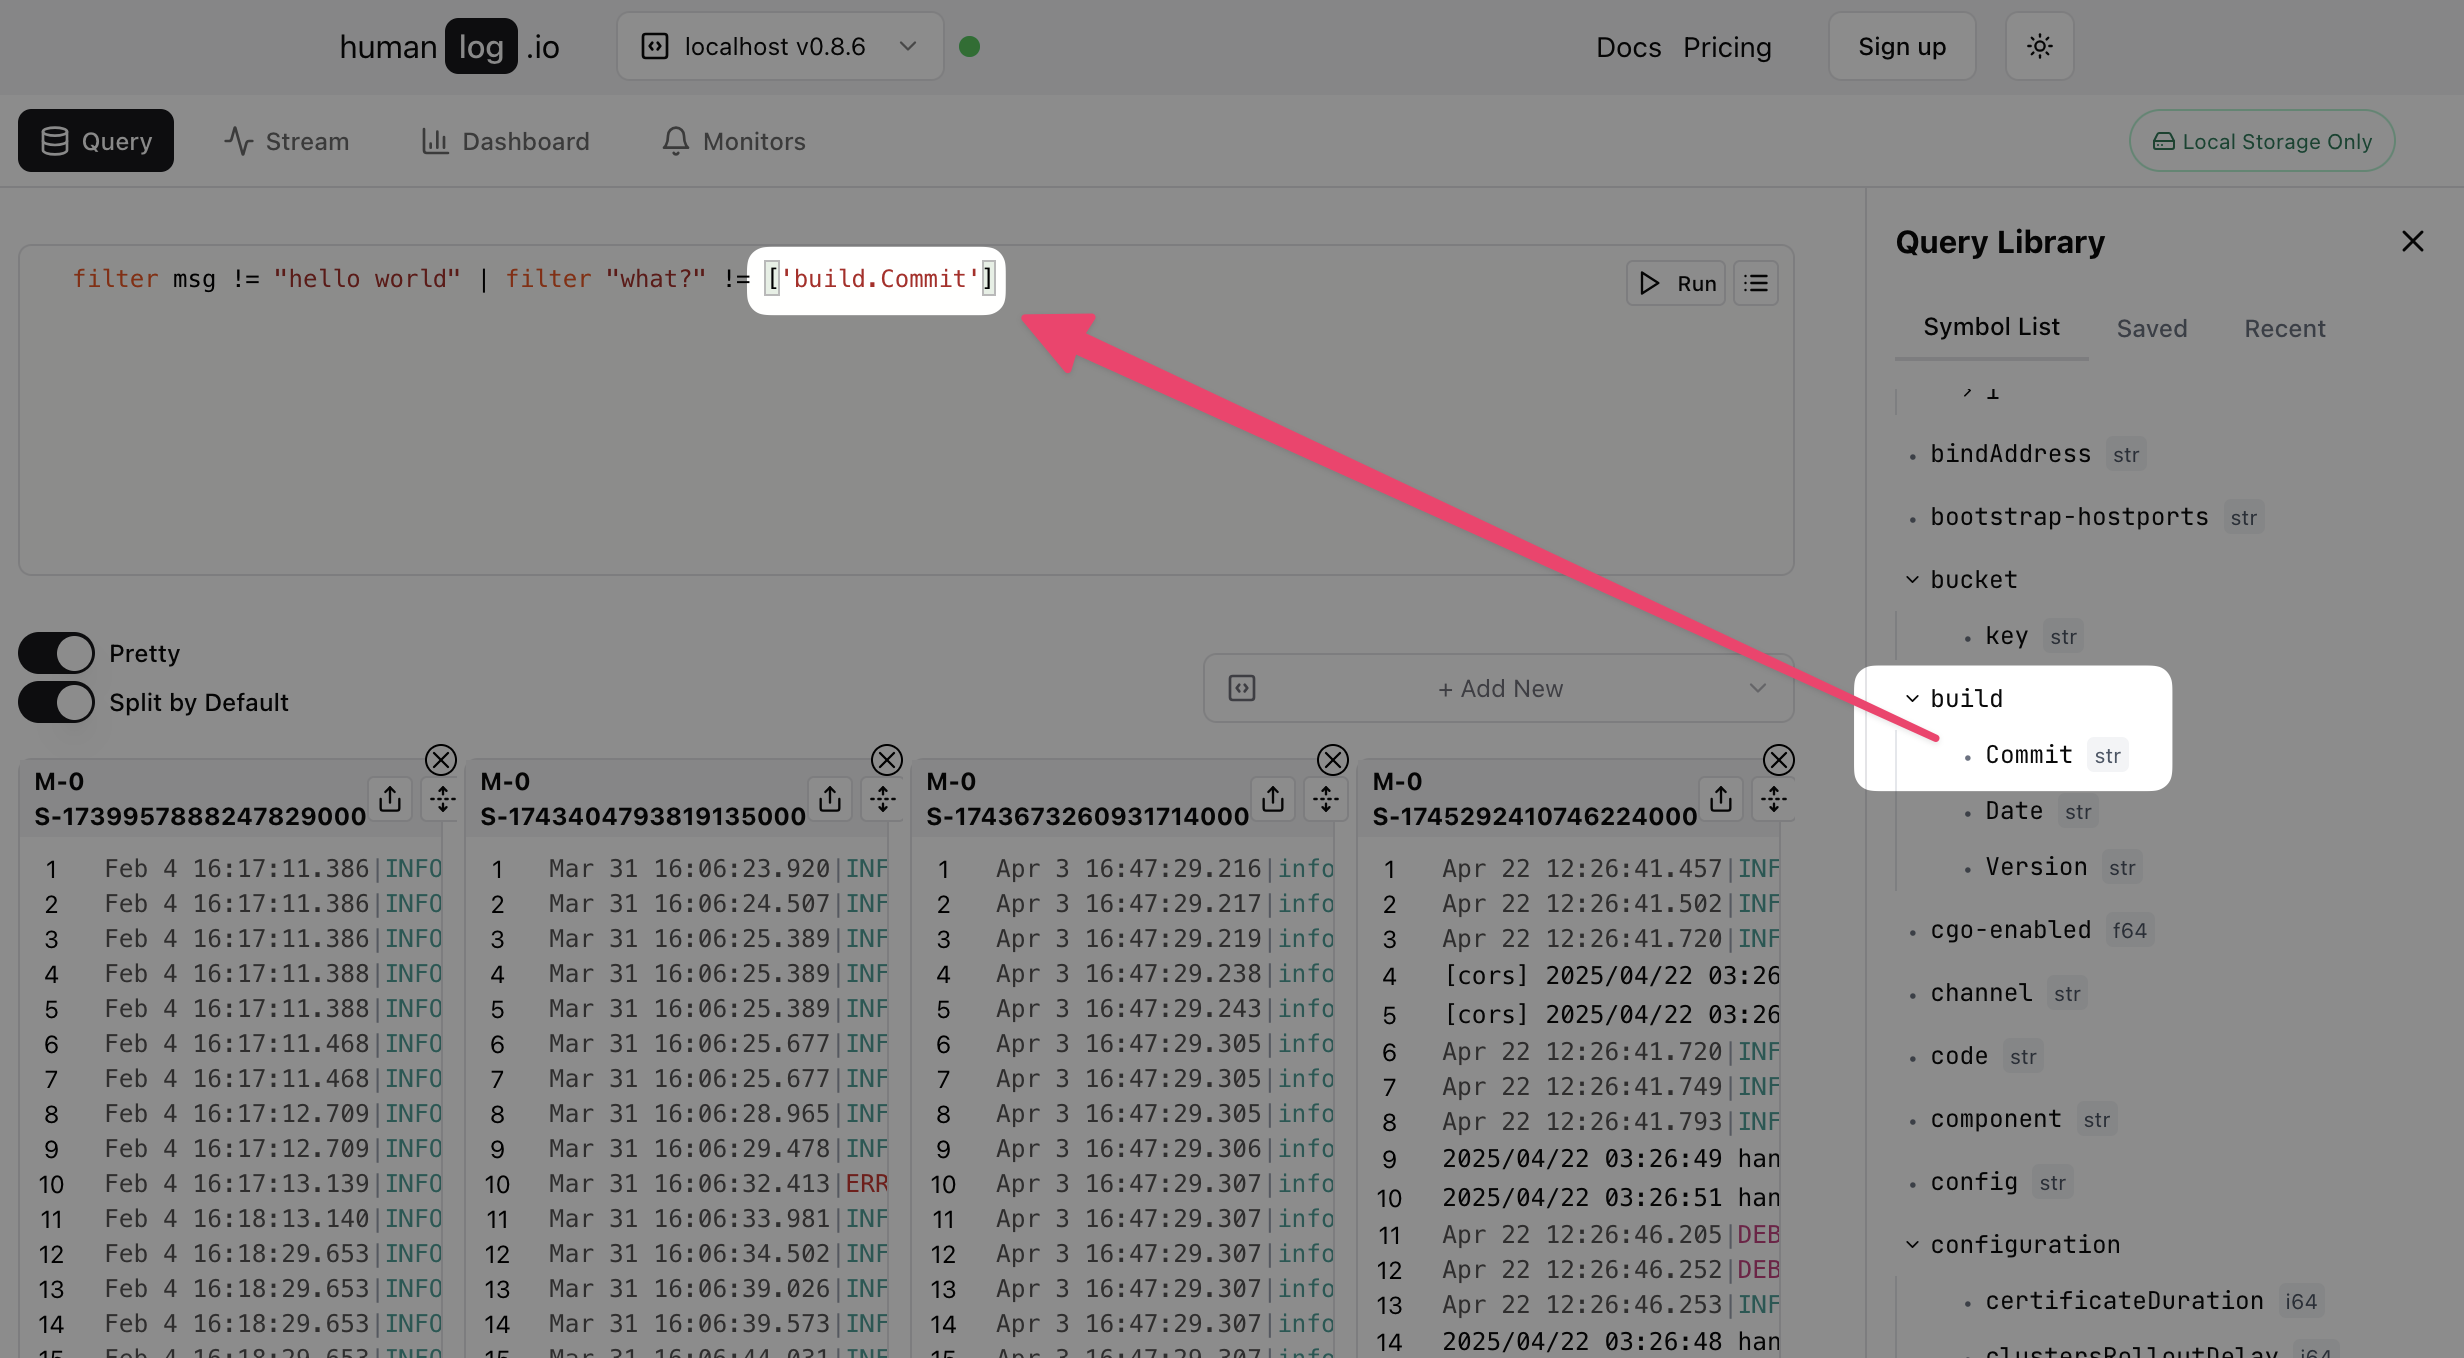
Alternatively, you can type it out manually. The rules for referring to arbitrary symbols are:
- If the symbol contains only letters, numbers and underscores, you can refer to it as-is.
- Otherwise, you must refer to it as an index expression, using single or double quoted strings like
["my symbol.name!"]or['my symbol.name!'].
Example:
// `request_id` is a symbol found in the key-values of your logs
filter request_id == "2937400f-b5c5-426f-b07a-4c7723ff6740"

// `build.Commit` is a symbol found in the key-values of your logs
// it contains a `.` so it must be escaped.
filter ['build.Commit'] == "d31fade"
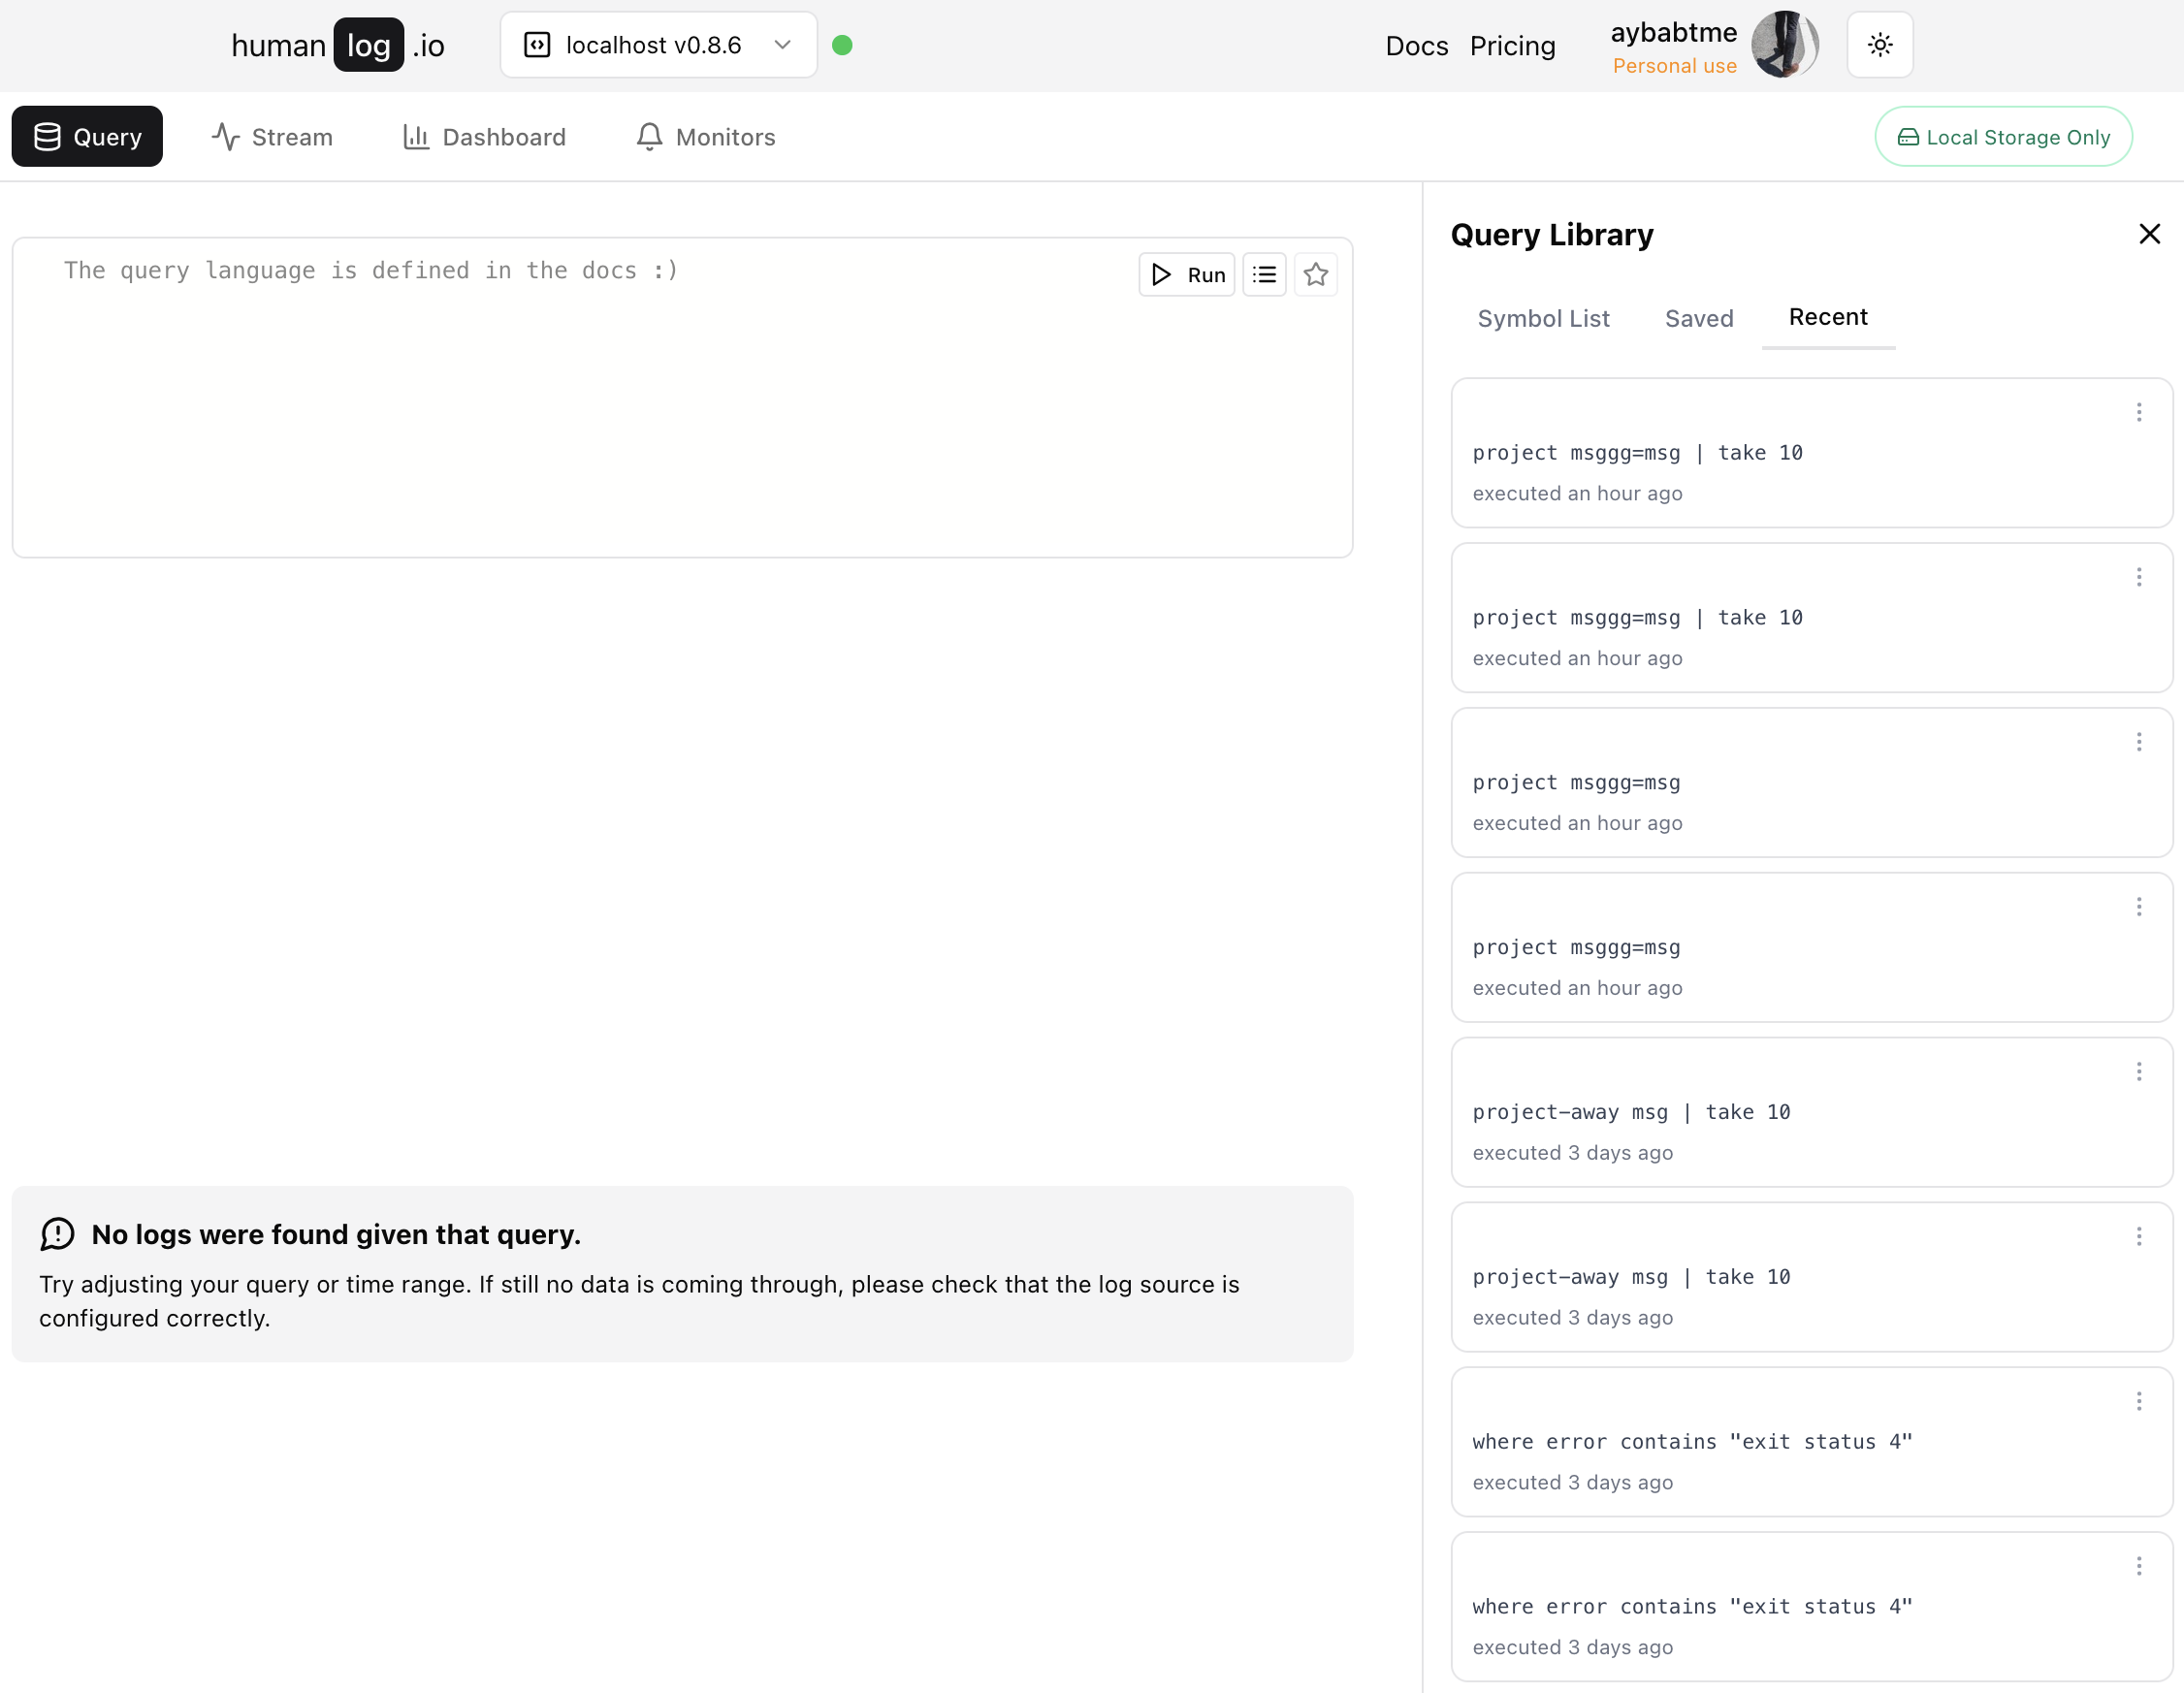
Reviewing Historical Queries
Every query that you run is automatically saved in your "Recent queries" list. This allows you to quickly retrieve results from previous queries, creating a fast feedback loop during debugging sessions. To see your recent queries, open the query library sidebar.
Then click on the "Recent queries" tab.
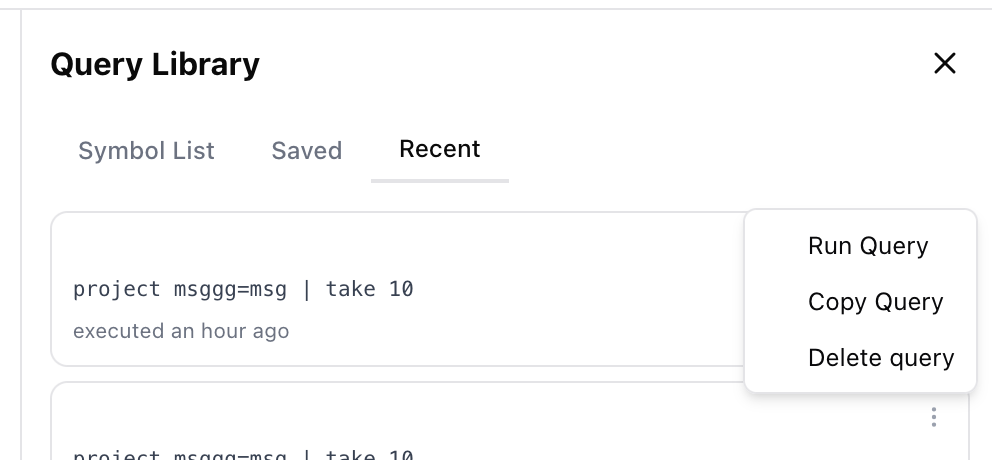
You can run, copy or delete recent queries from this list.
Saving Your Favorite Queries
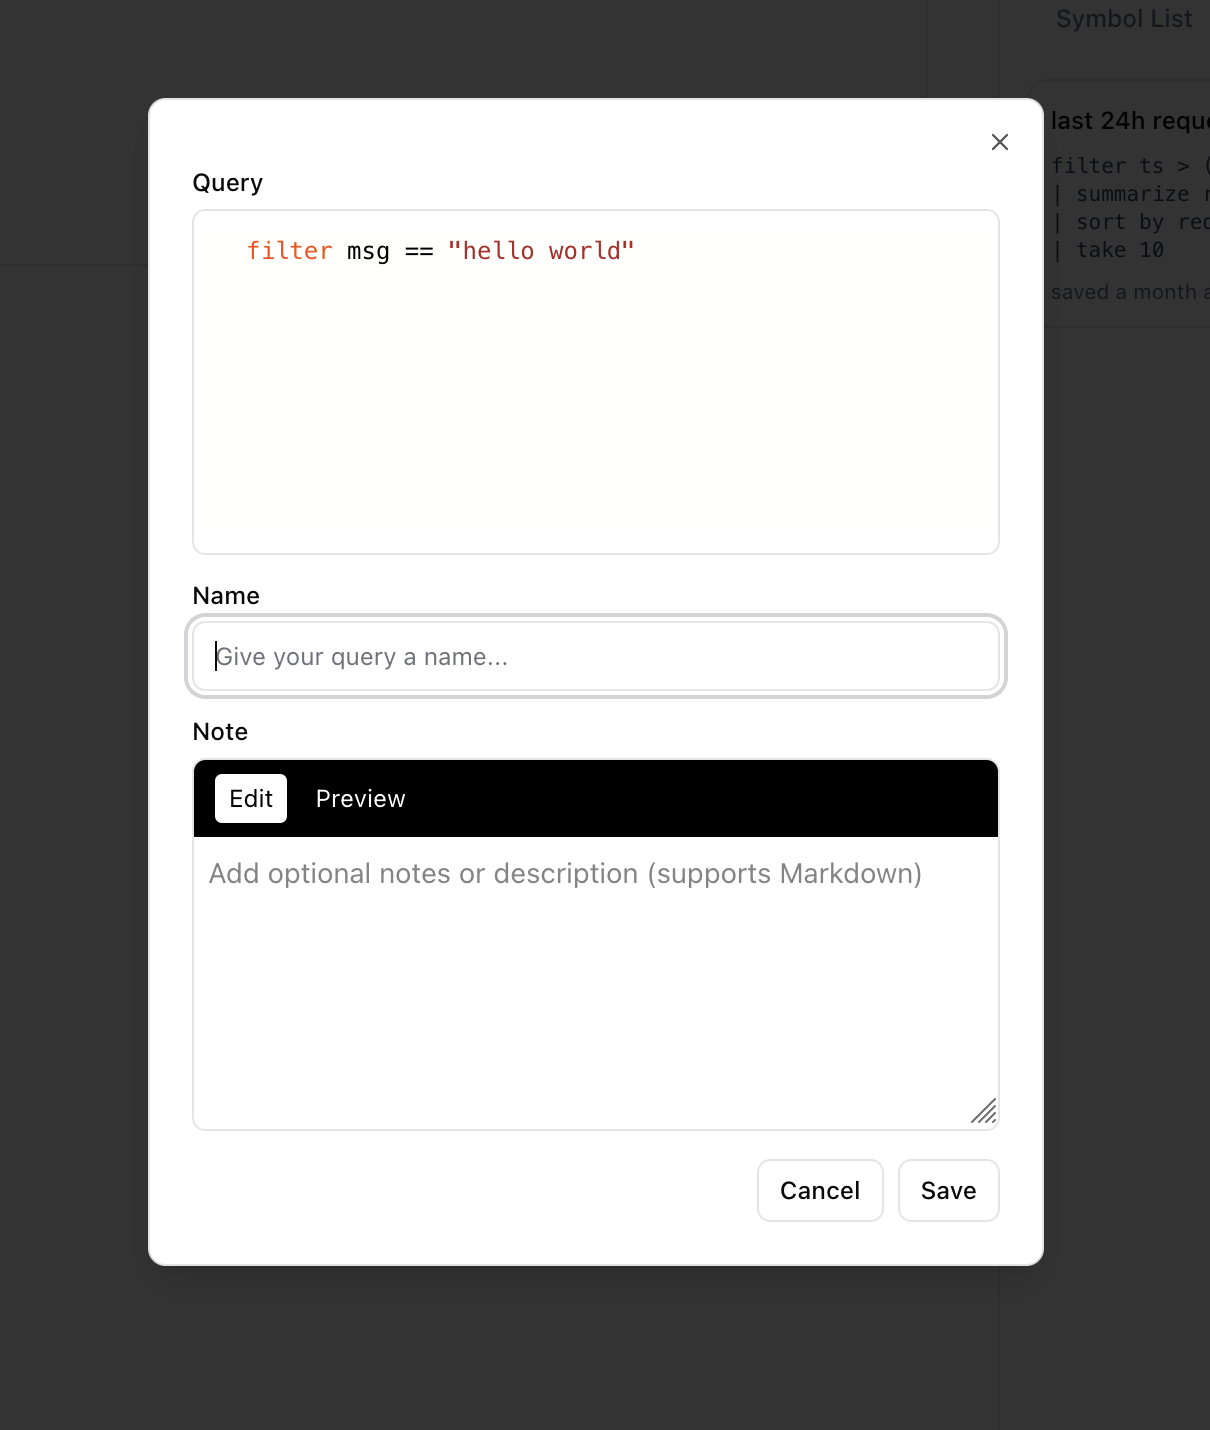
You can save queries into your "Saved queries" collection by clicking on the "Save" button in the query tab.
This will open a modal where you can name your query and add a note.
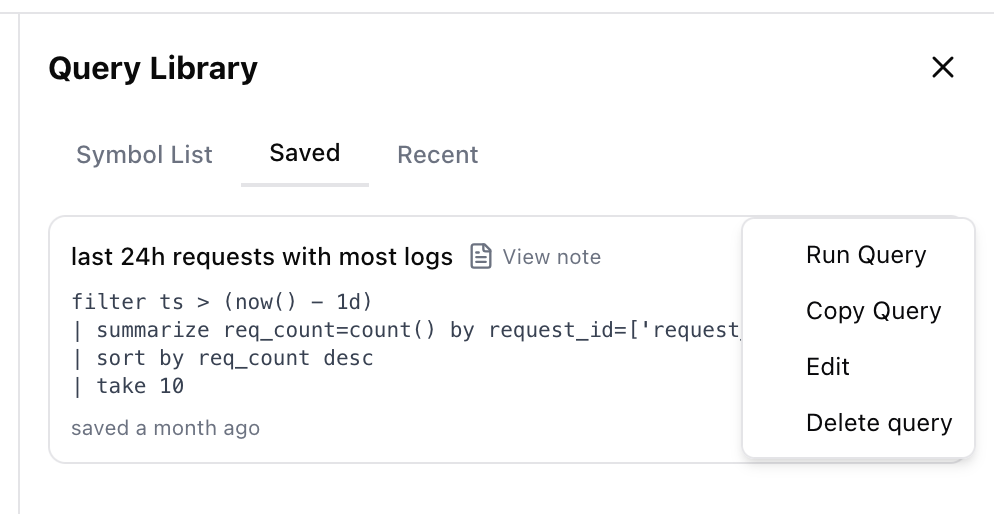
You can review the saved queries in the "Query library" side bar. First click on the query library button.
Then click on the "Saved queries" tab.
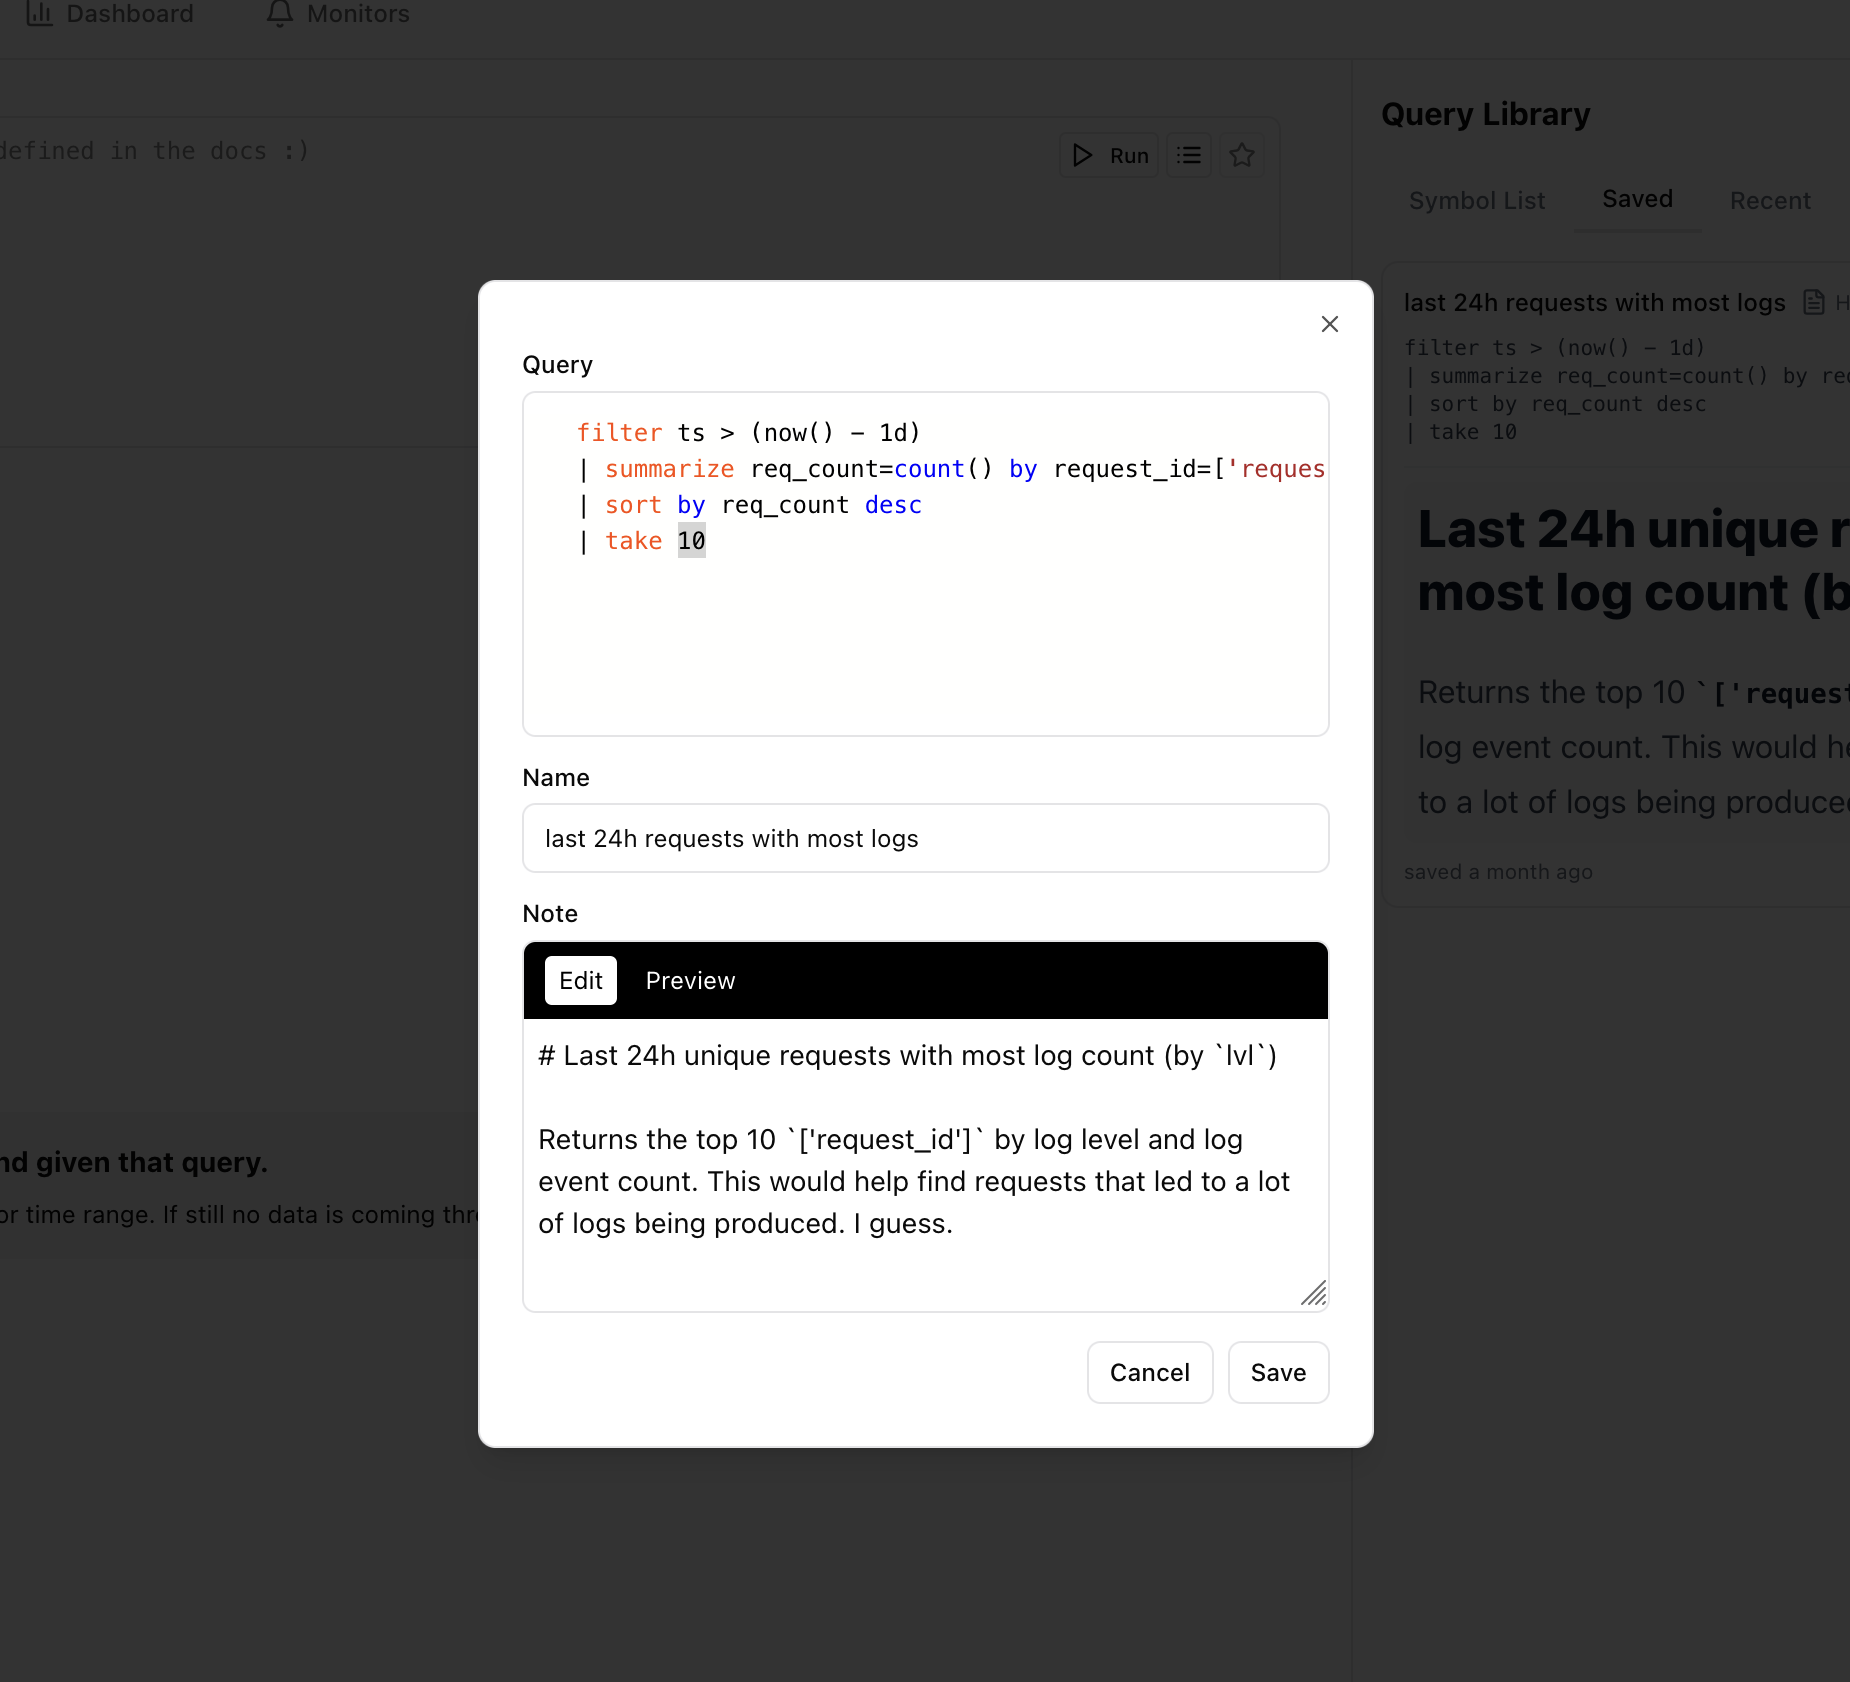
You can run, copy, edit or delete saved queries from this list.
Saved queries can be edited and have notes attached to them, so you can remember why you saved them and any details relevant to running them.
Query Results
The query result area displays the output of your query. The presentation format adapts based on the detected datatype, with the query engine selecting an appropriate rendering method. You can customize the appearance using themes if needed. See the themes section for more information.
Logs
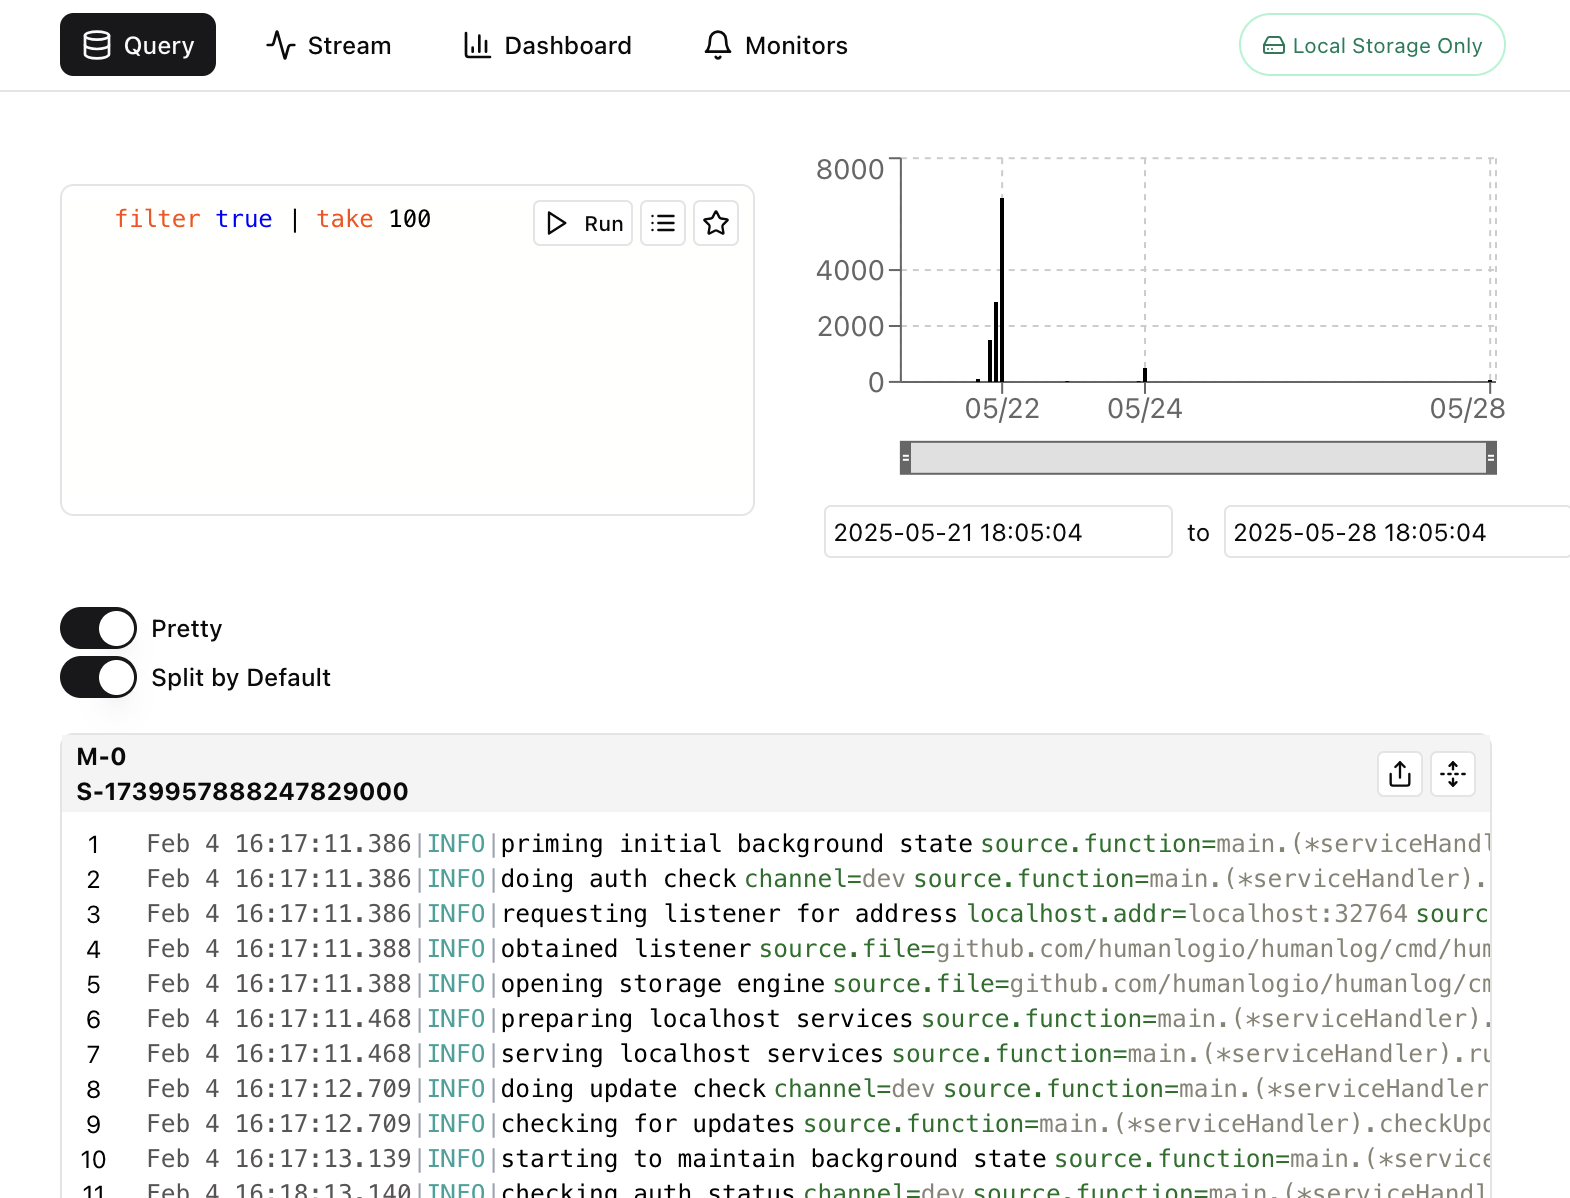
When querying logs data, the results will be displayed in prettified form using the signature display format of humanlog. This is the same format that humanlog uses when ingesting logs, and it looks like this:
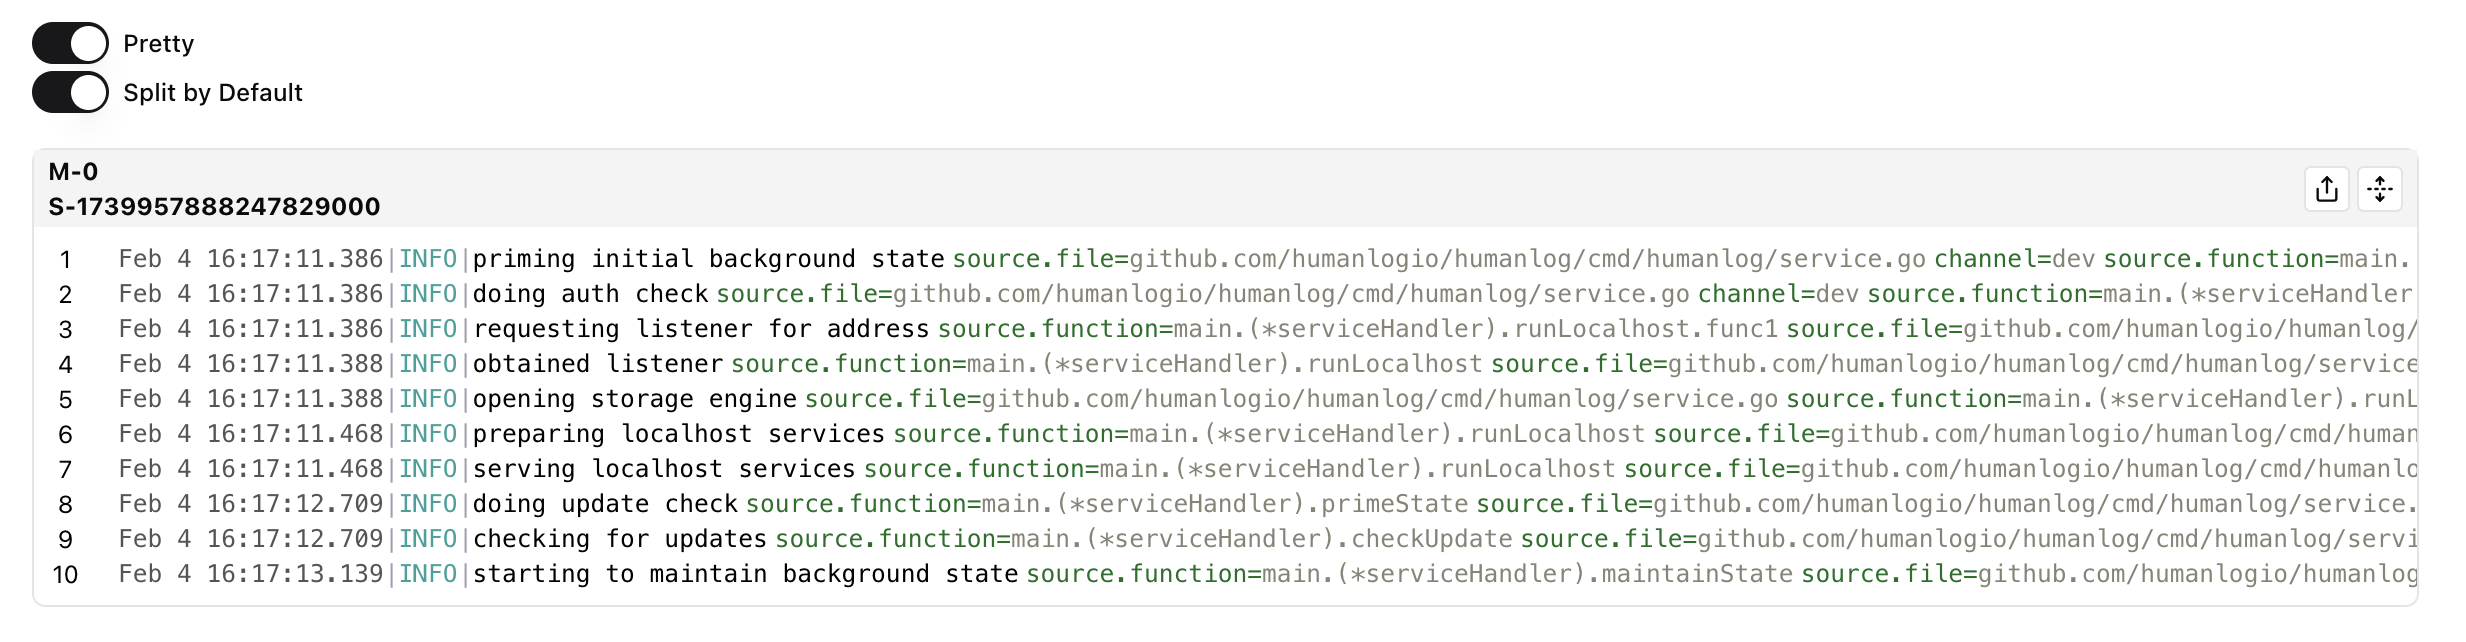
By default, the query engine groups logs by session. This ensures that logs are displayed in a logical order based on their emission source, providing a coherent view of system behavior. See the logging section for more information about log ordering.
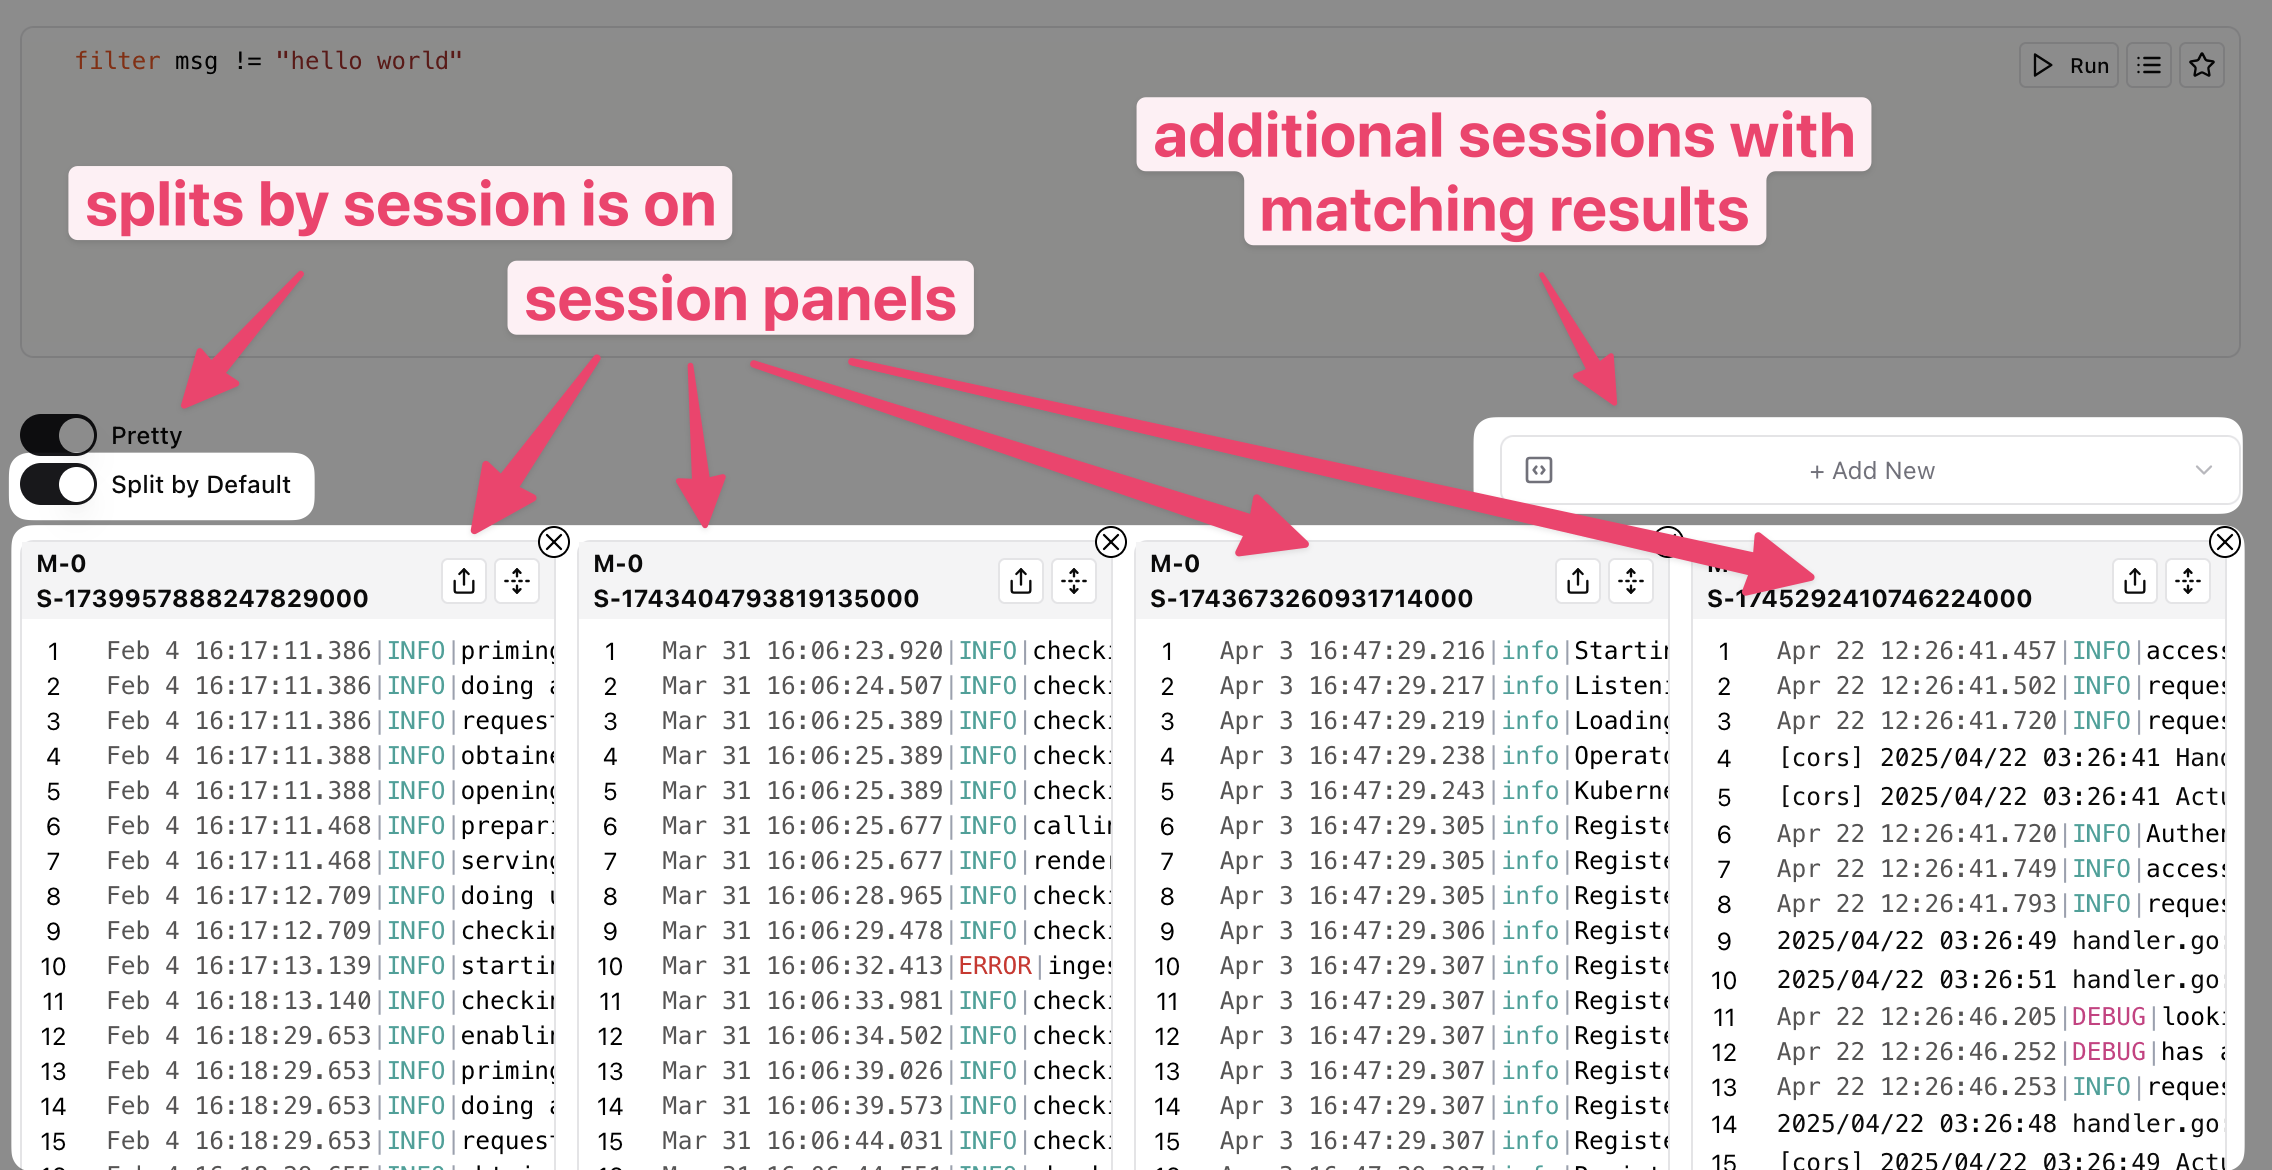
You can disable this behavior by turning off the "Split By Session" toggle.
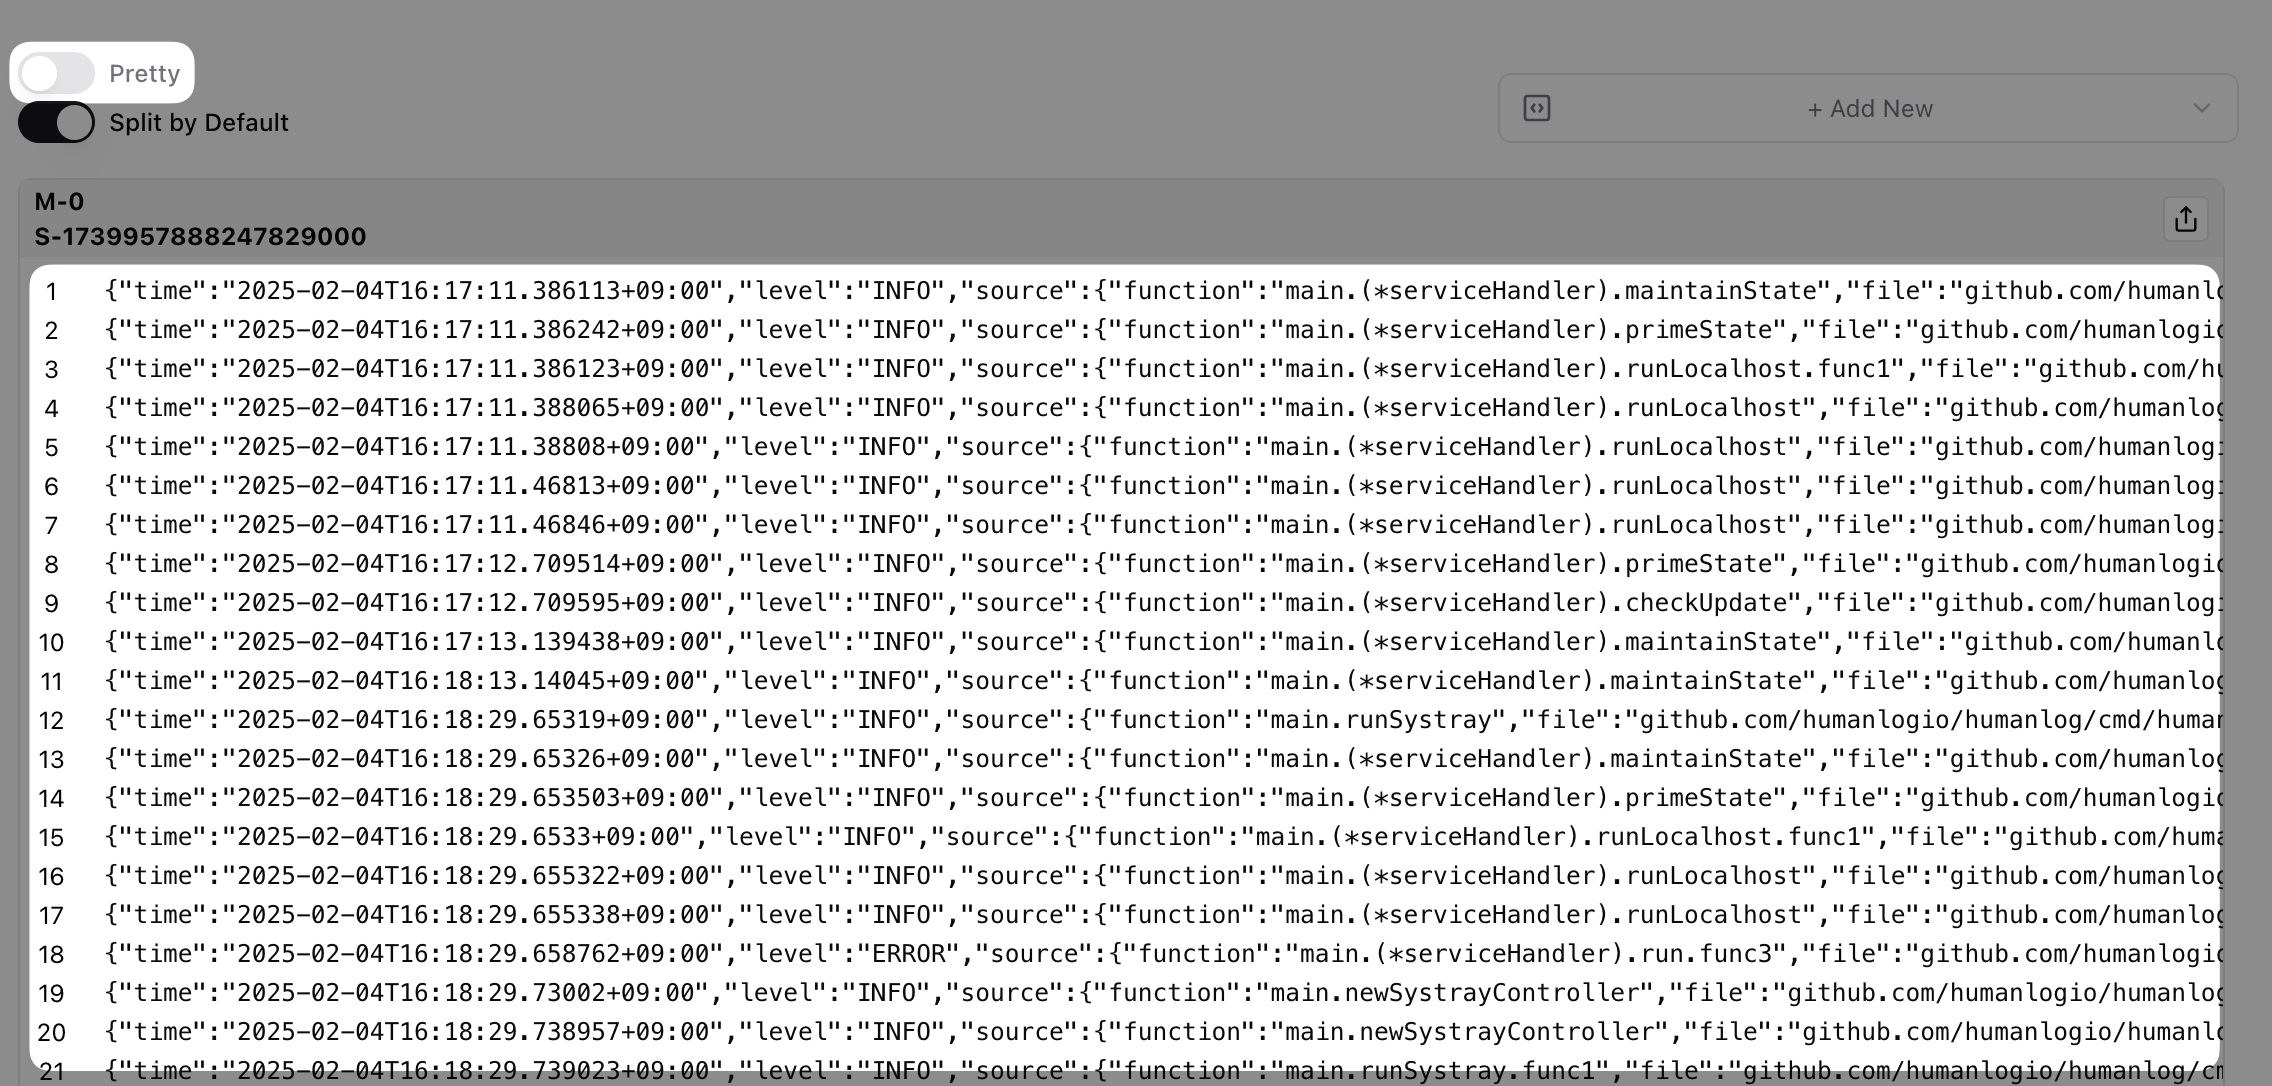
If you don't want to see prettified results, you can turn off the "Pretty" toggle to see the logs in their raw form, as they were ingested.
You can hover over a log to see its metadata. Depending on where you hover, you will see different things. Hovering over the timestamp, level or message will let you see the core information about the log line such as the event ID, timestamp, level, message.
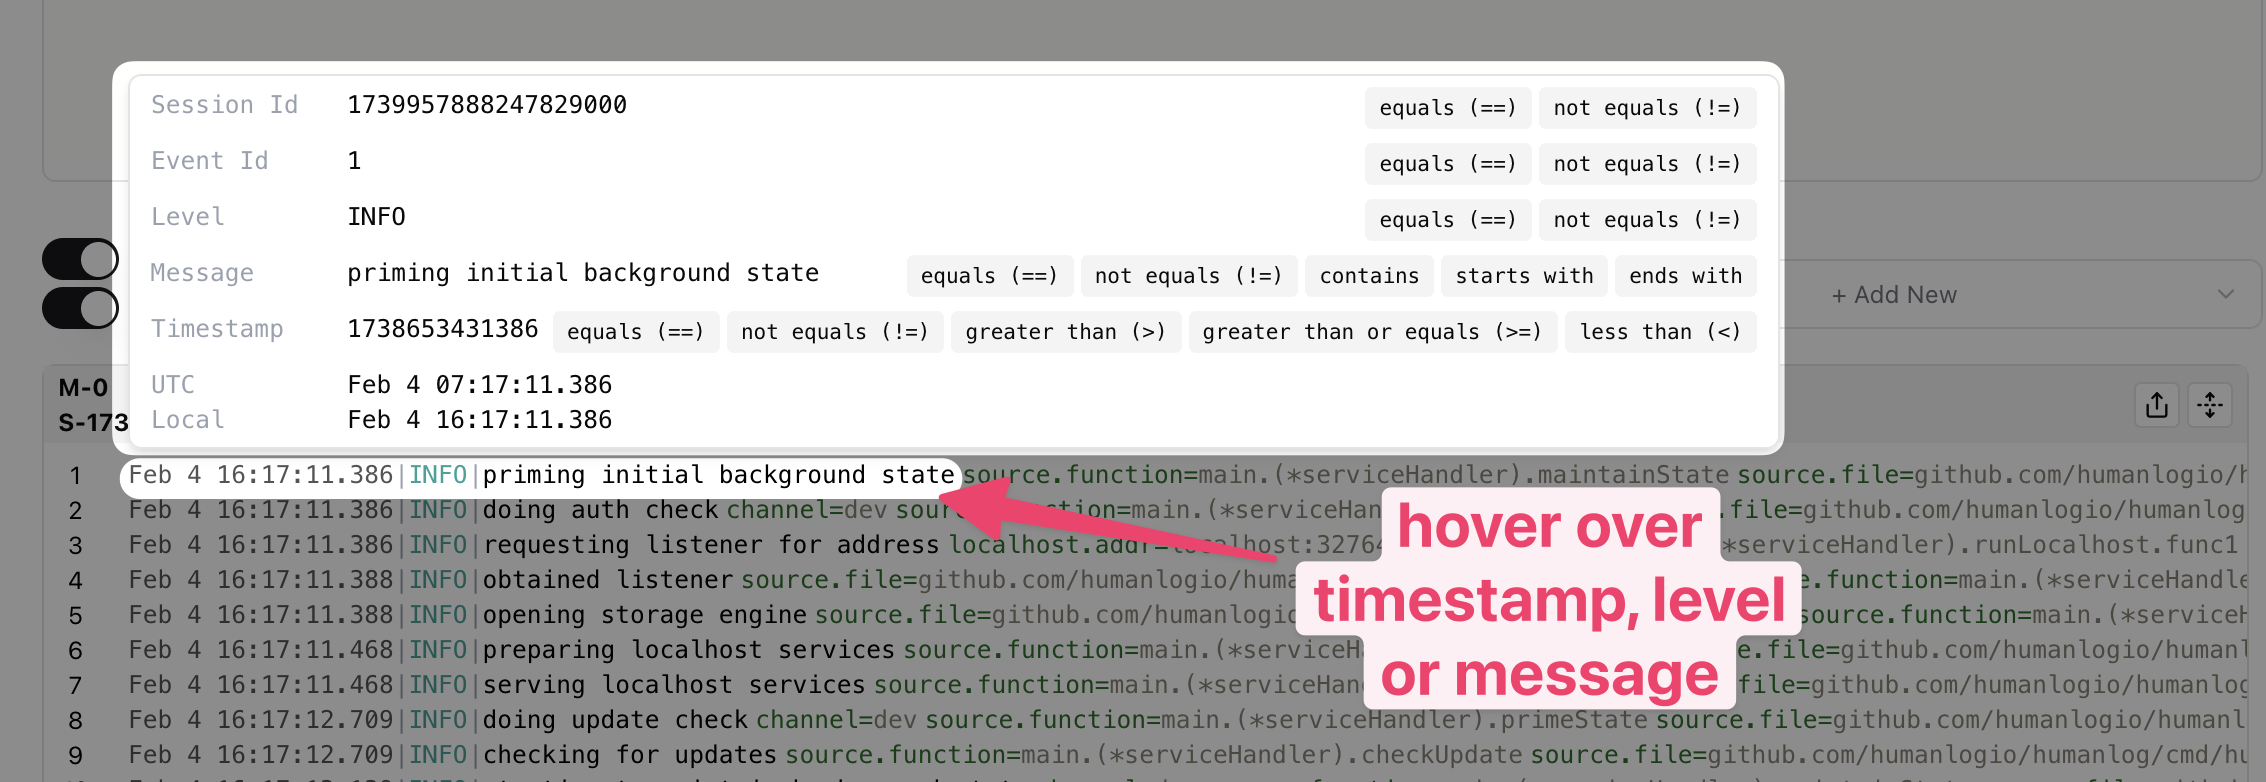
You can click on the tooltip buttons to help further filter down the results. Doing so will update your query to add a filter clause.
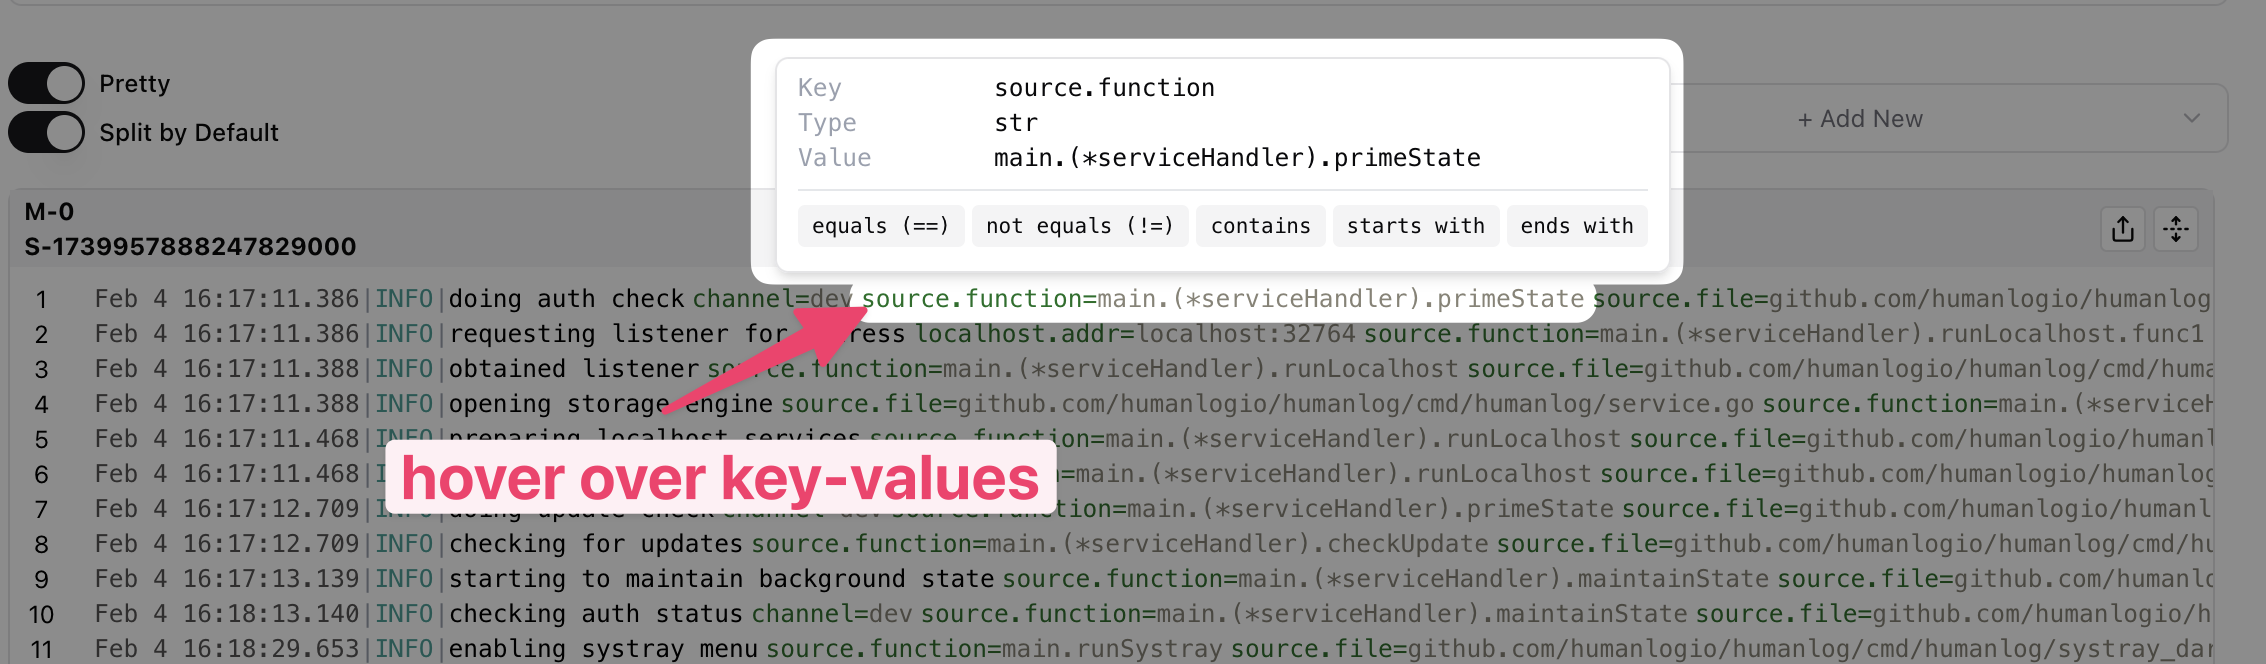
You can hover over a key-value to see its value, its type and then click on premade filters to add to your query.
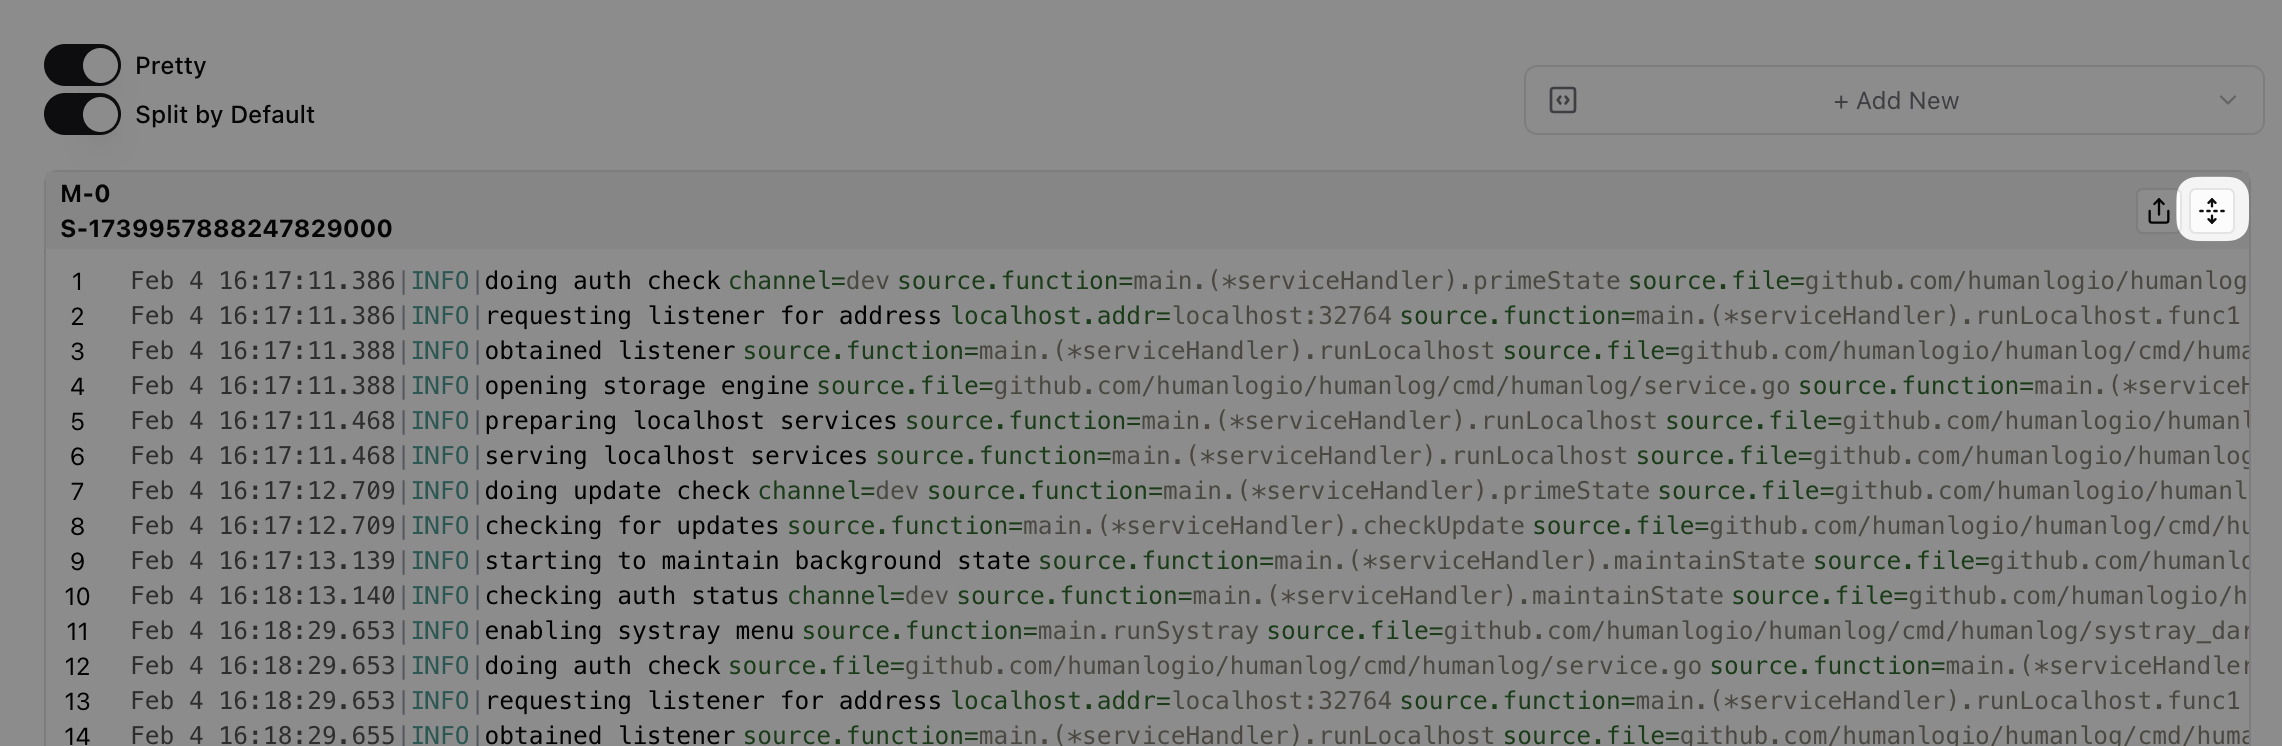
Sometimes log lines, even when prettified, can become quite long. In these cases, you may want to display log lines vertically for better readability. Click on the "Toggle section line breaks in log" button to activate this mode.
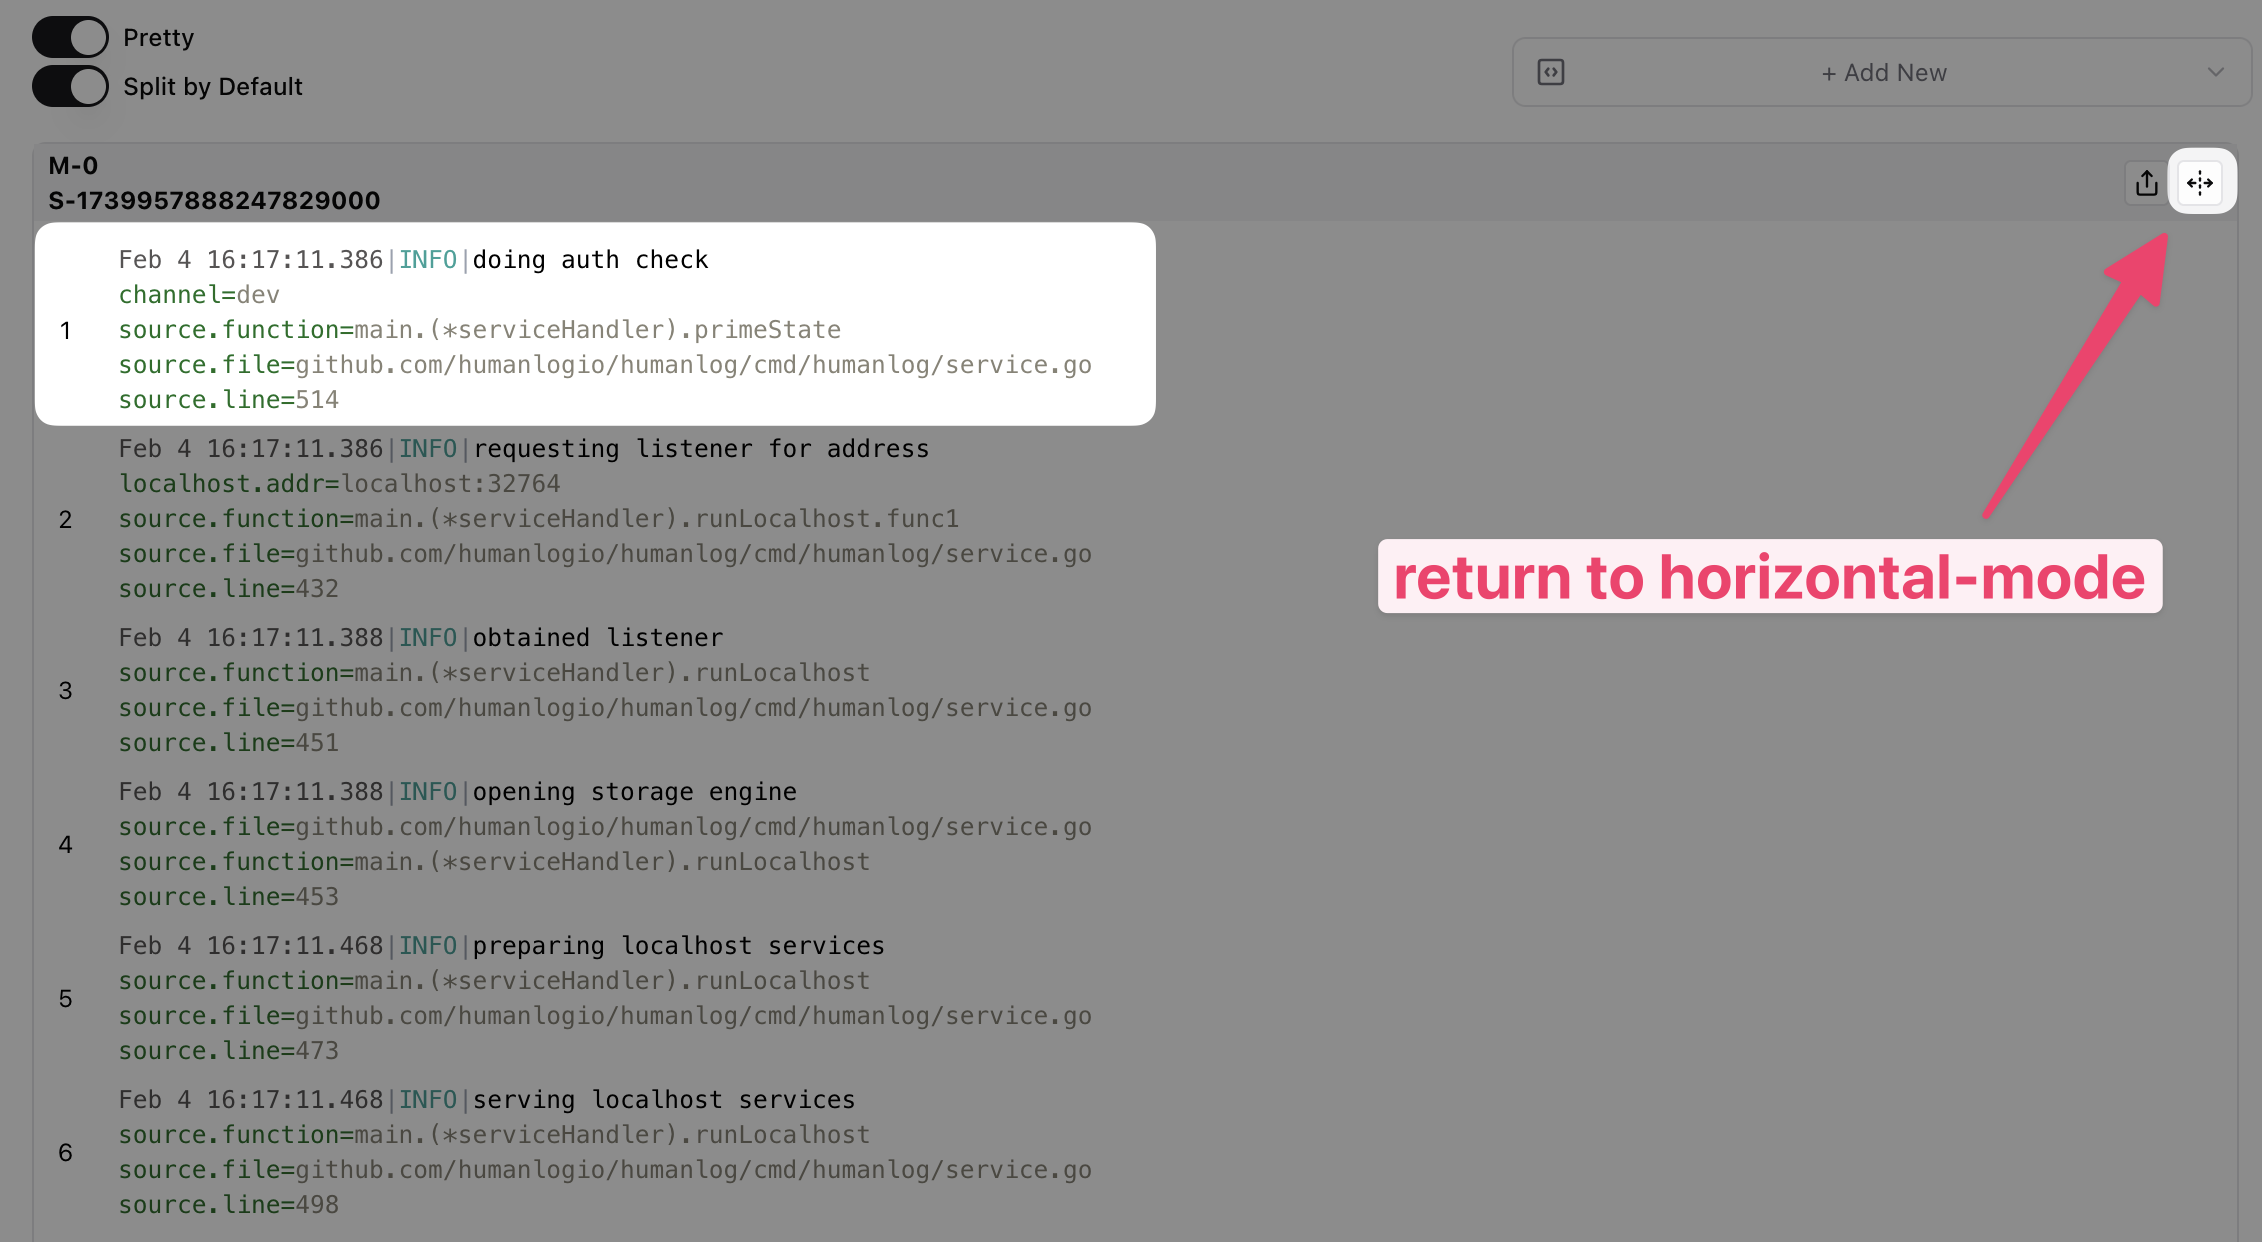
This displays your logs with each key-value pair on its own line. You can return to the horizontal layout by clicking on the "Toggle section line breaks in log" button again.
Spans
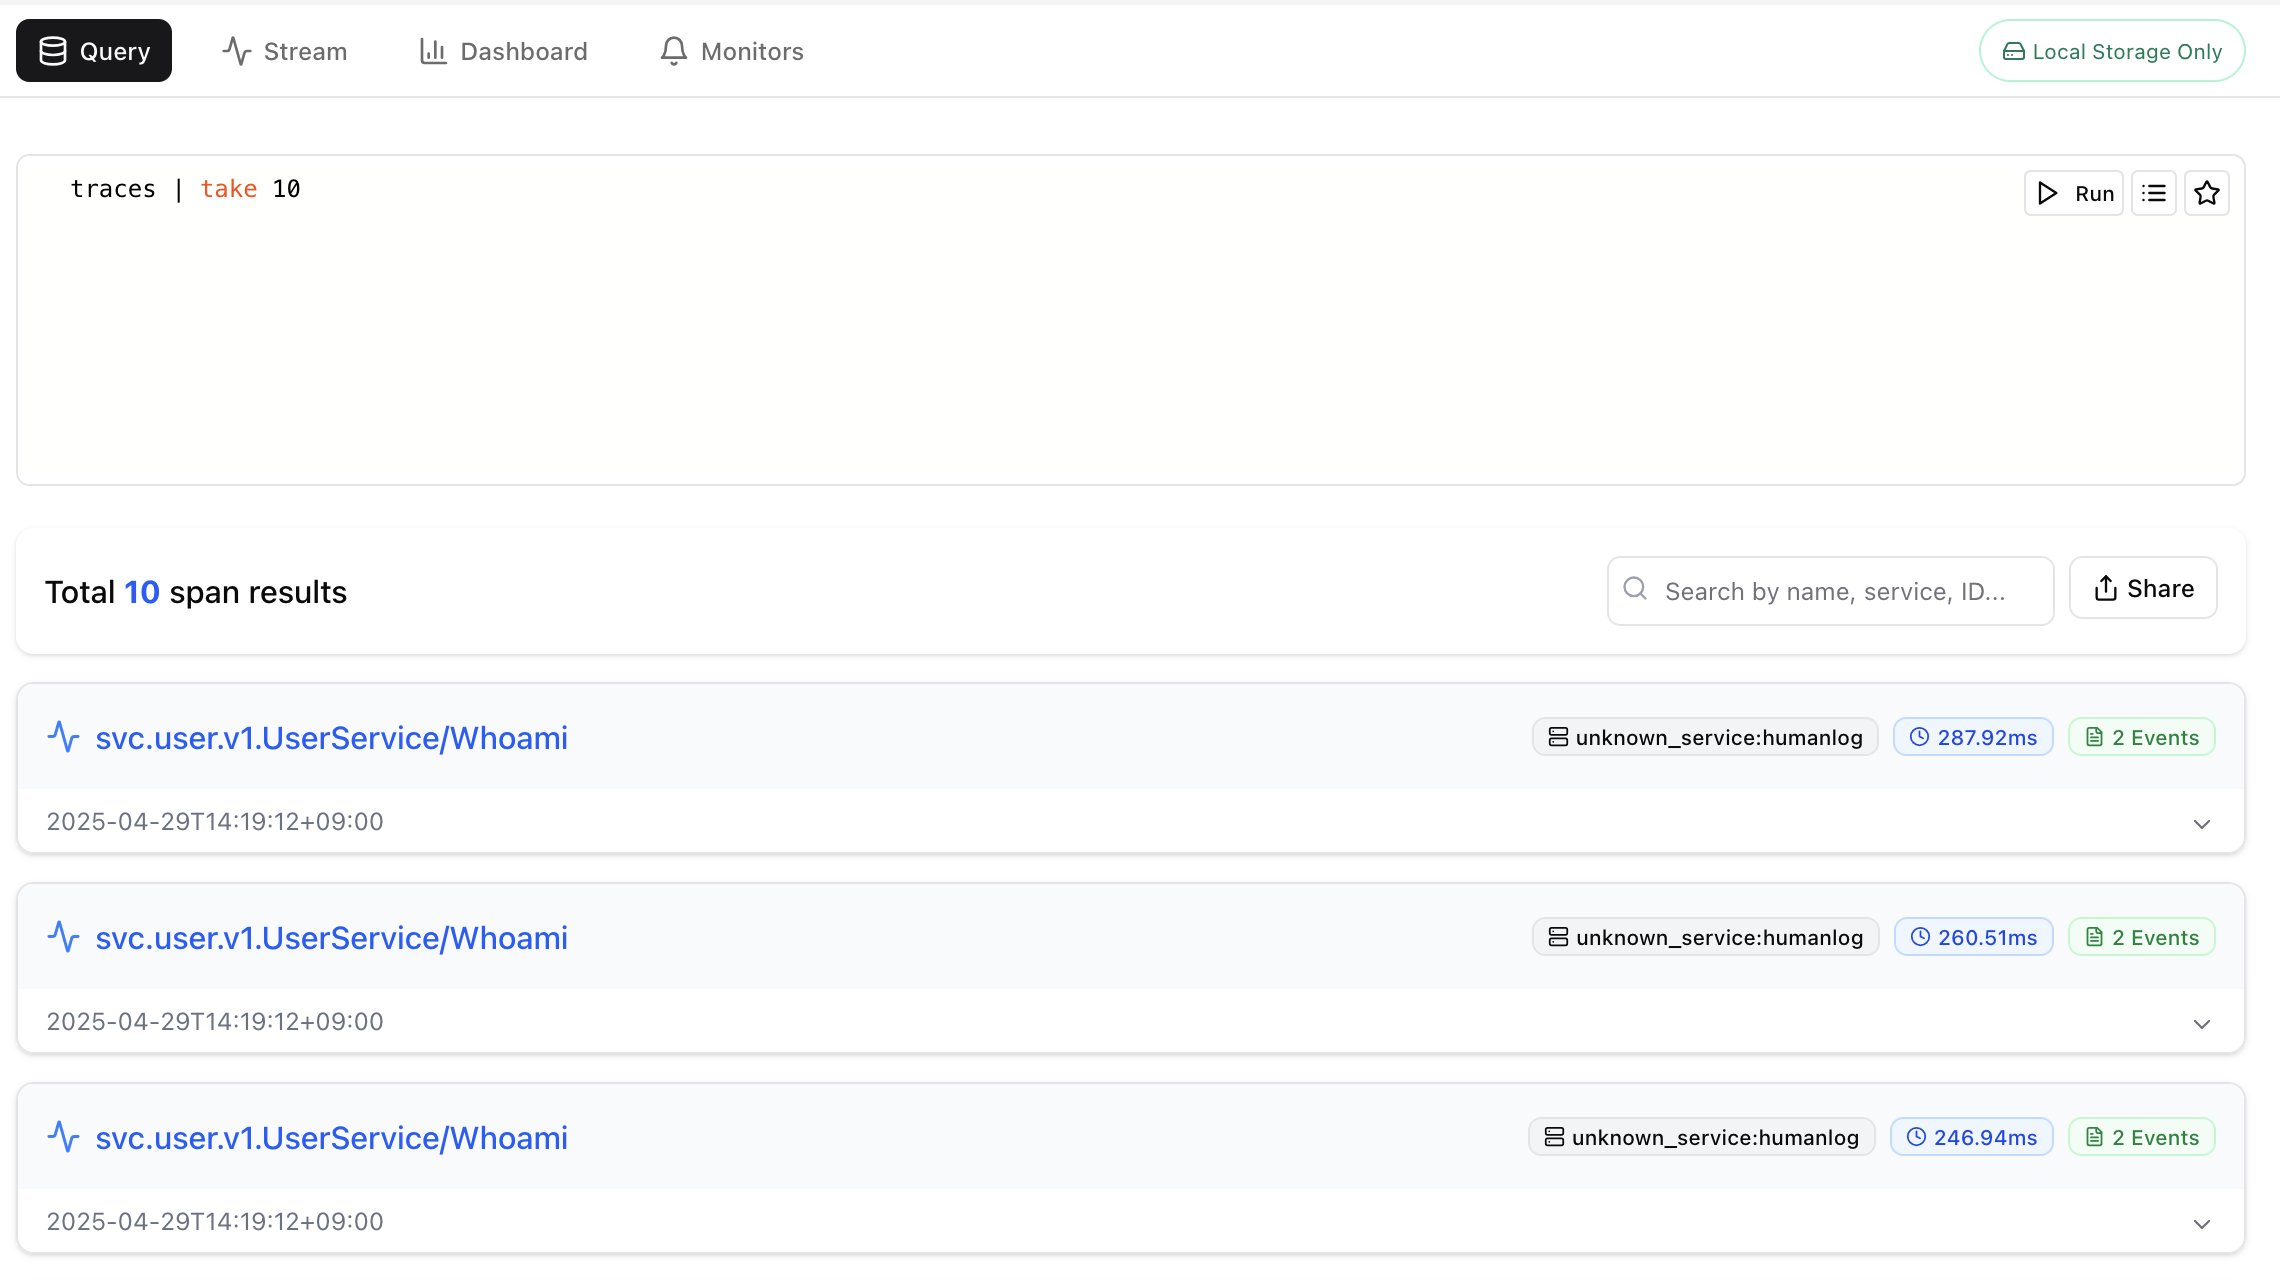
Query spans by specifying the spans dataset at the start of your query.
spans | take 10
This command will retrieve 10 spans from your tracing data and display them in span-mode, enabling you to debug your distributed system locally without deploying to production.
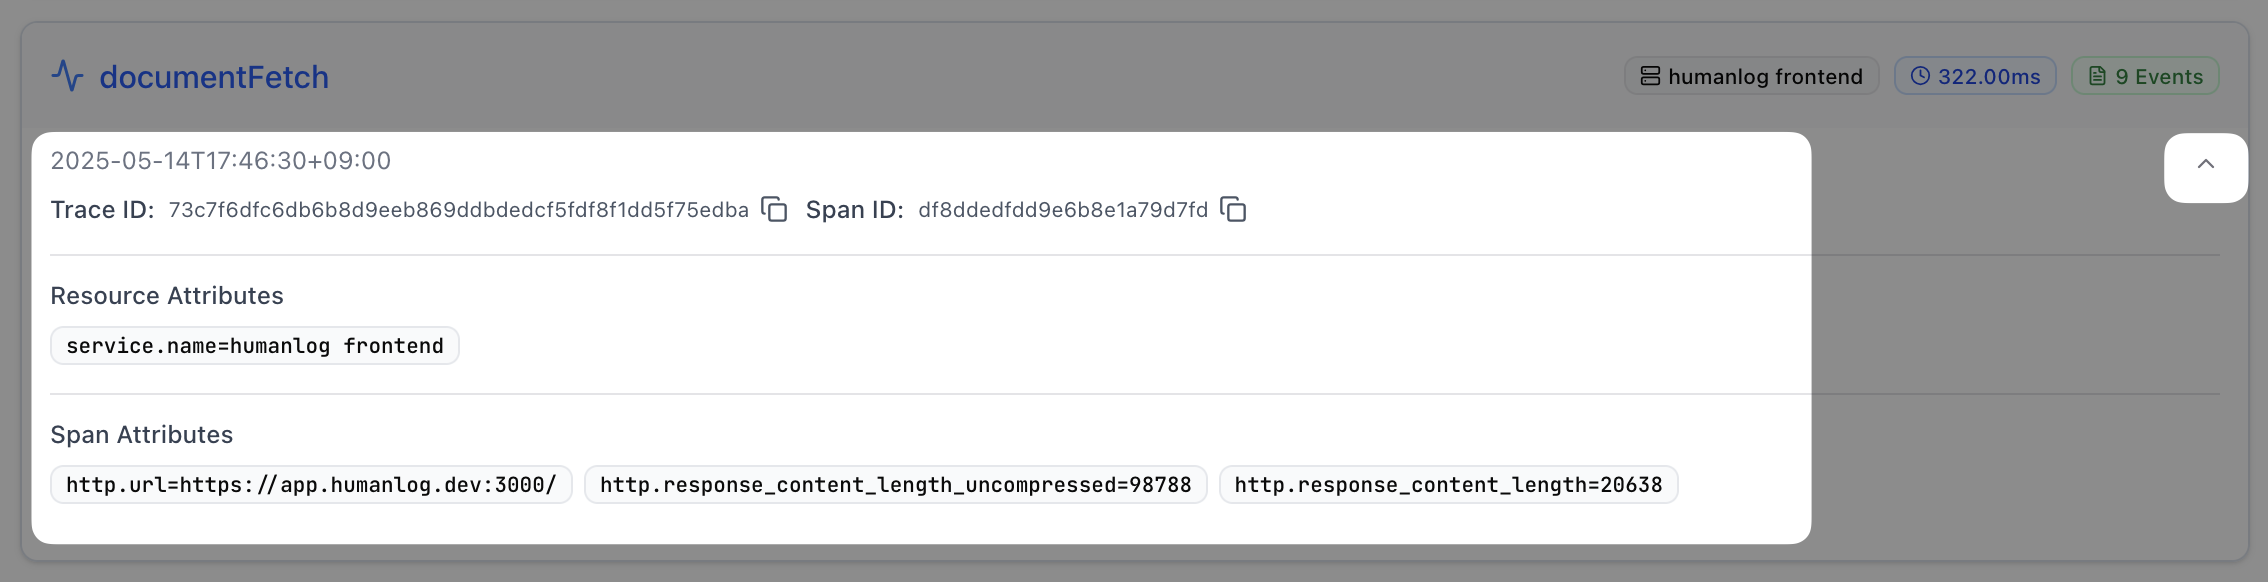
If you want to see more details about the span, such as its resource attributes or span attributes, click on the expand button.
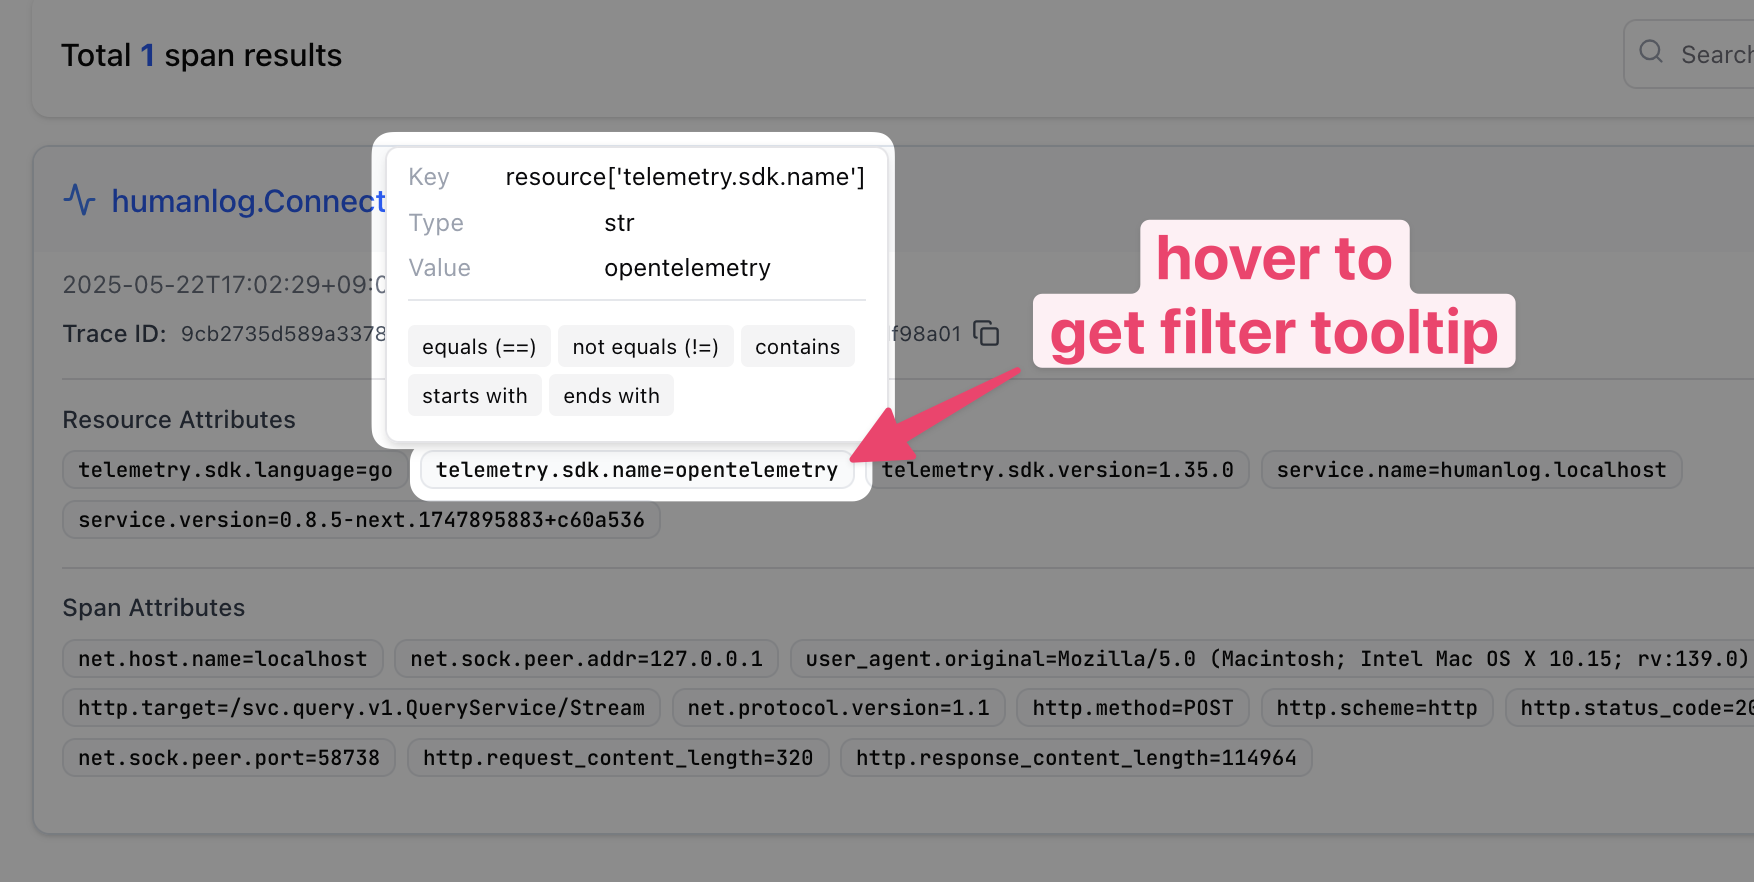
You can hover over a span to see its metadata. Clicking on the tooltip buttons will let you add premade filters to your query.
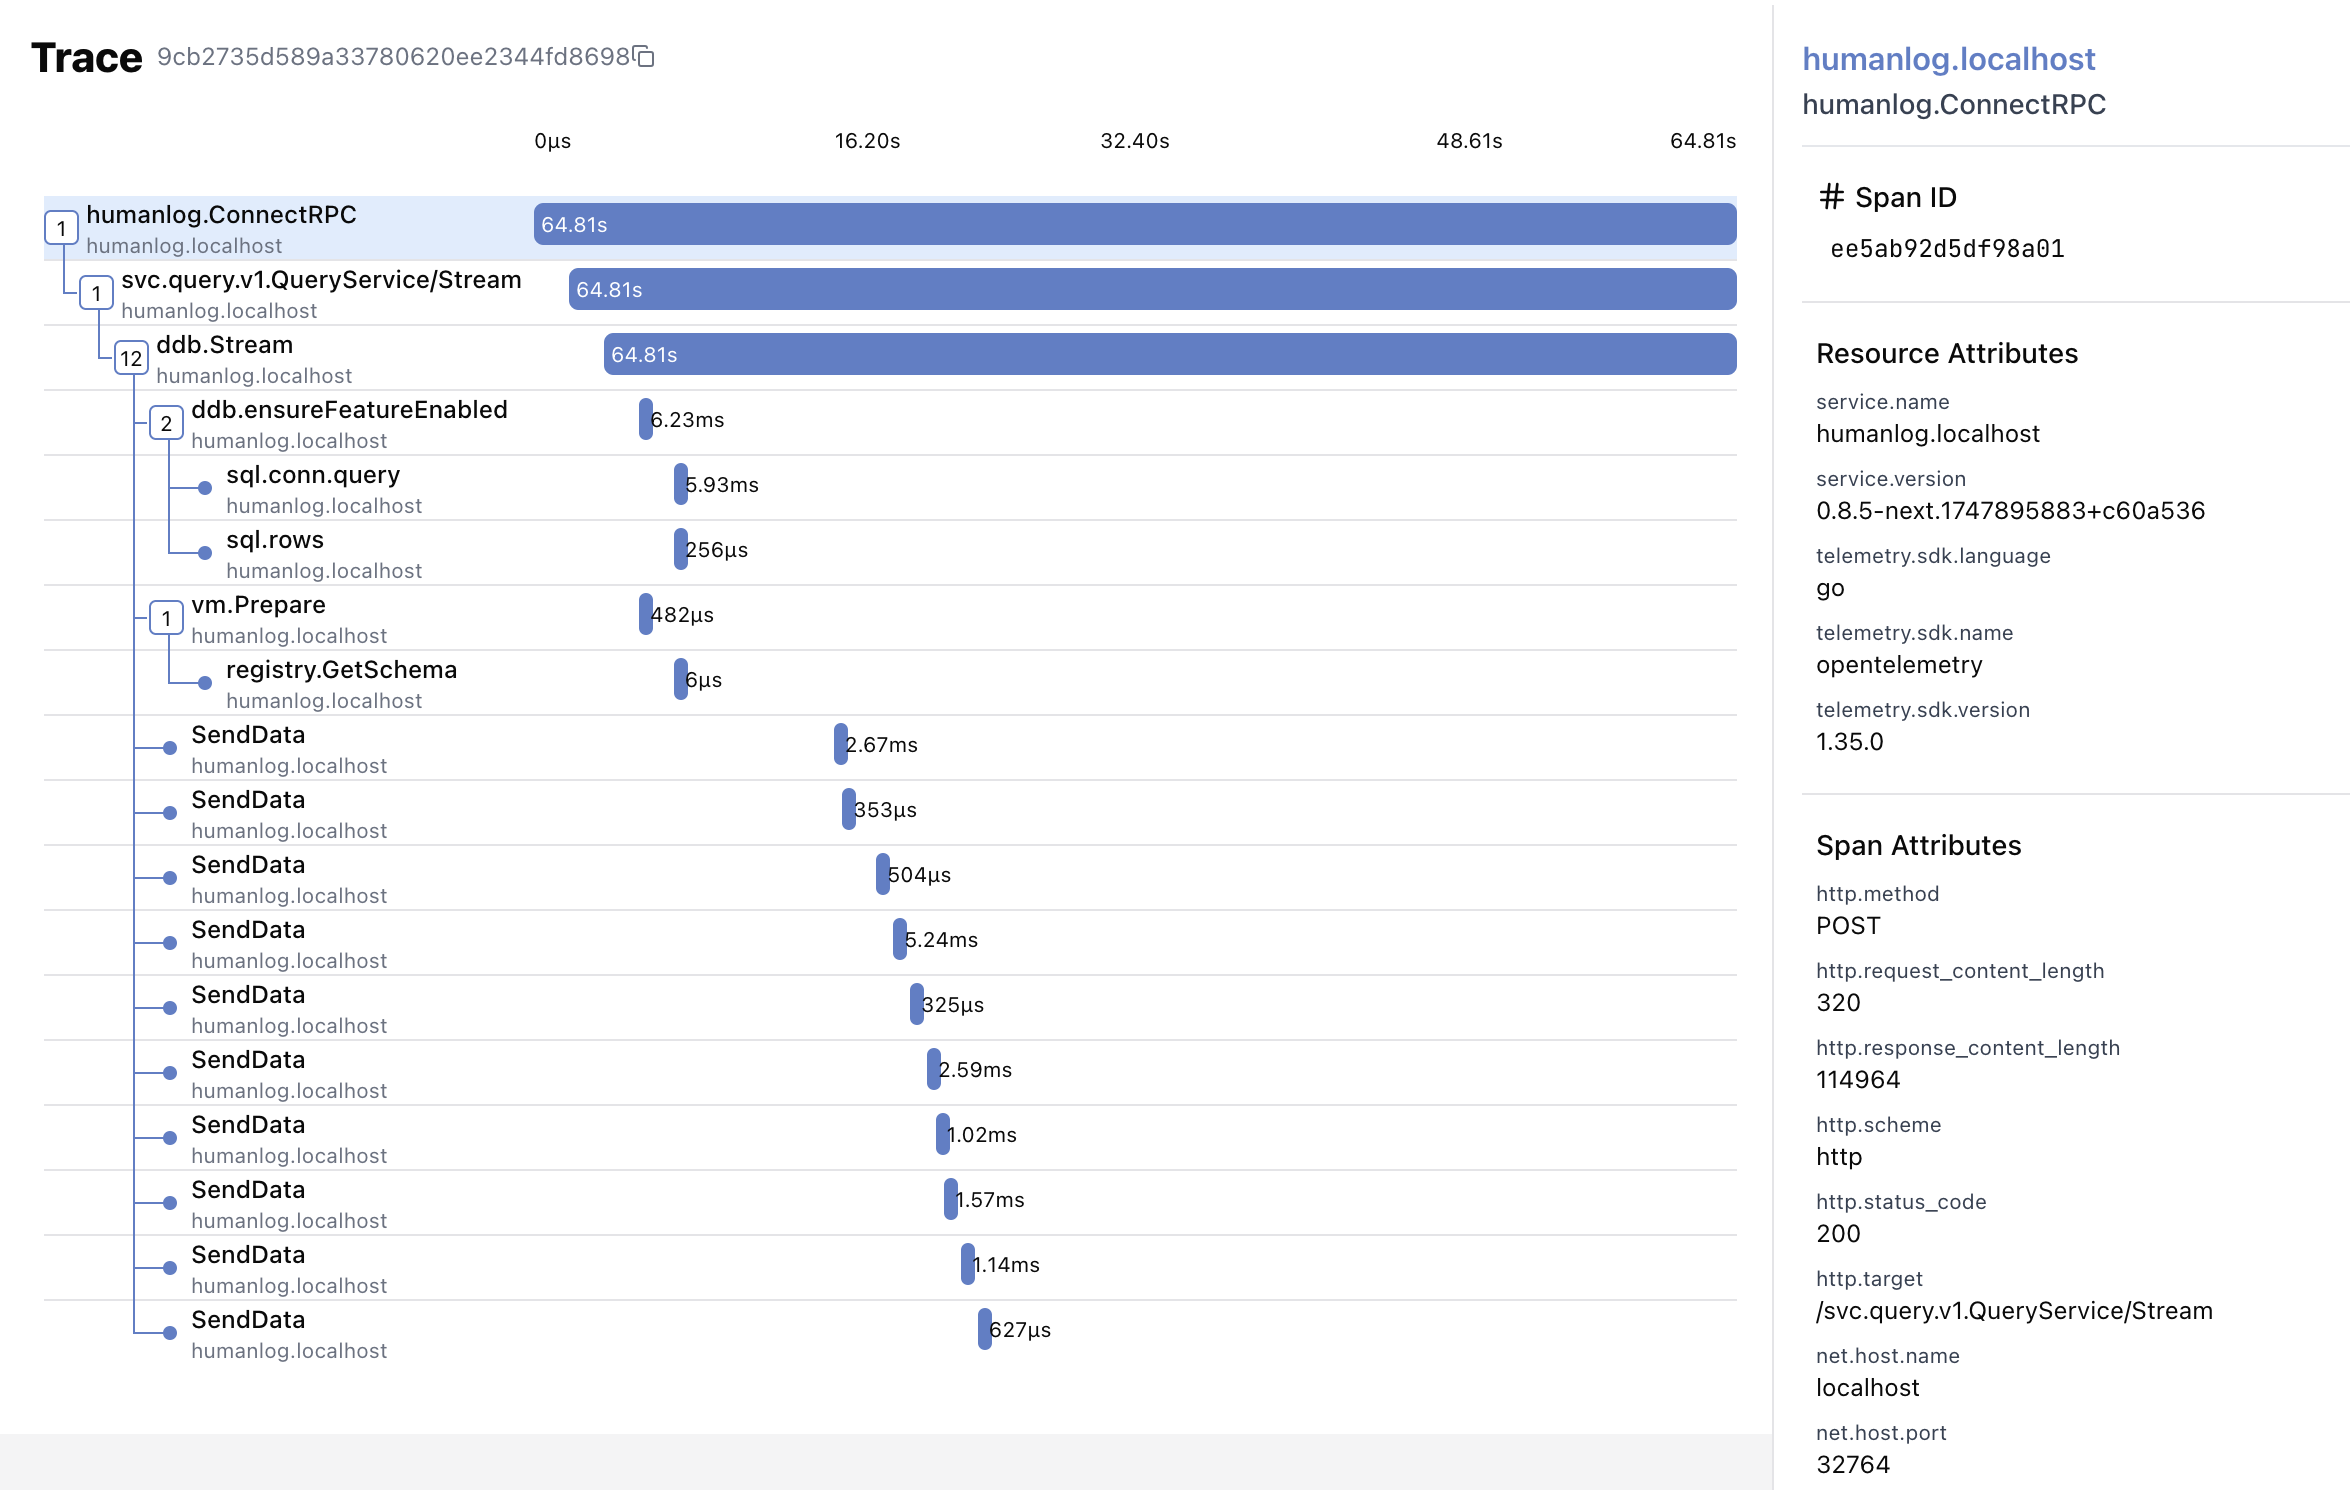
Otherwise clicking on the span name or trace ID will open a page that shows the span in its trace.
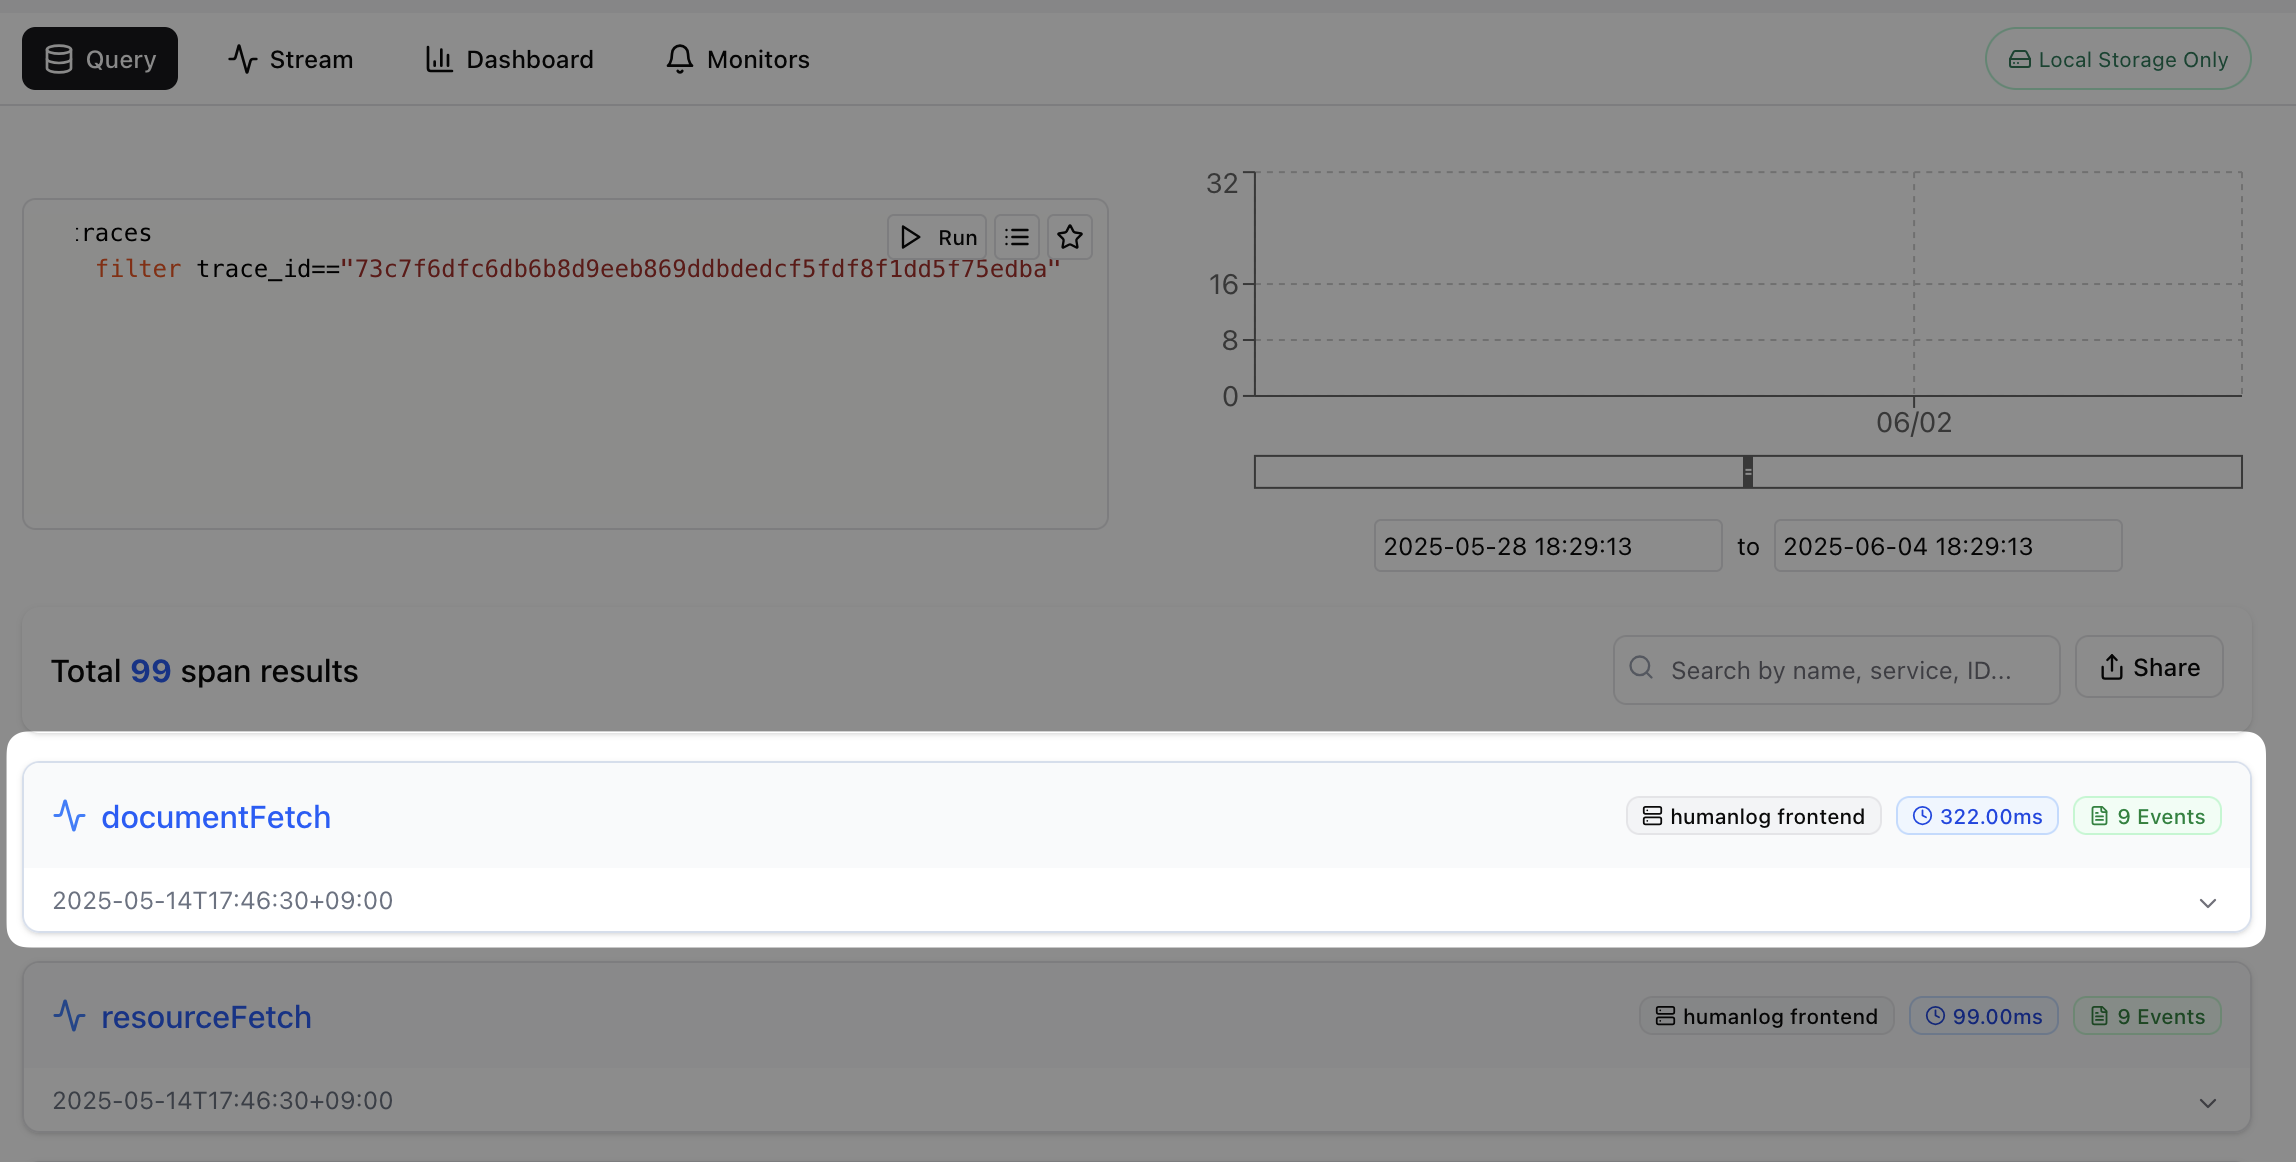
This page presents the span within the context of its trace, with all spans shown in an intuitive waterfall layout. You can view comprehensive details about the trace, allowing you to verify your instrumentation works correctly without deploying to production.
Tables
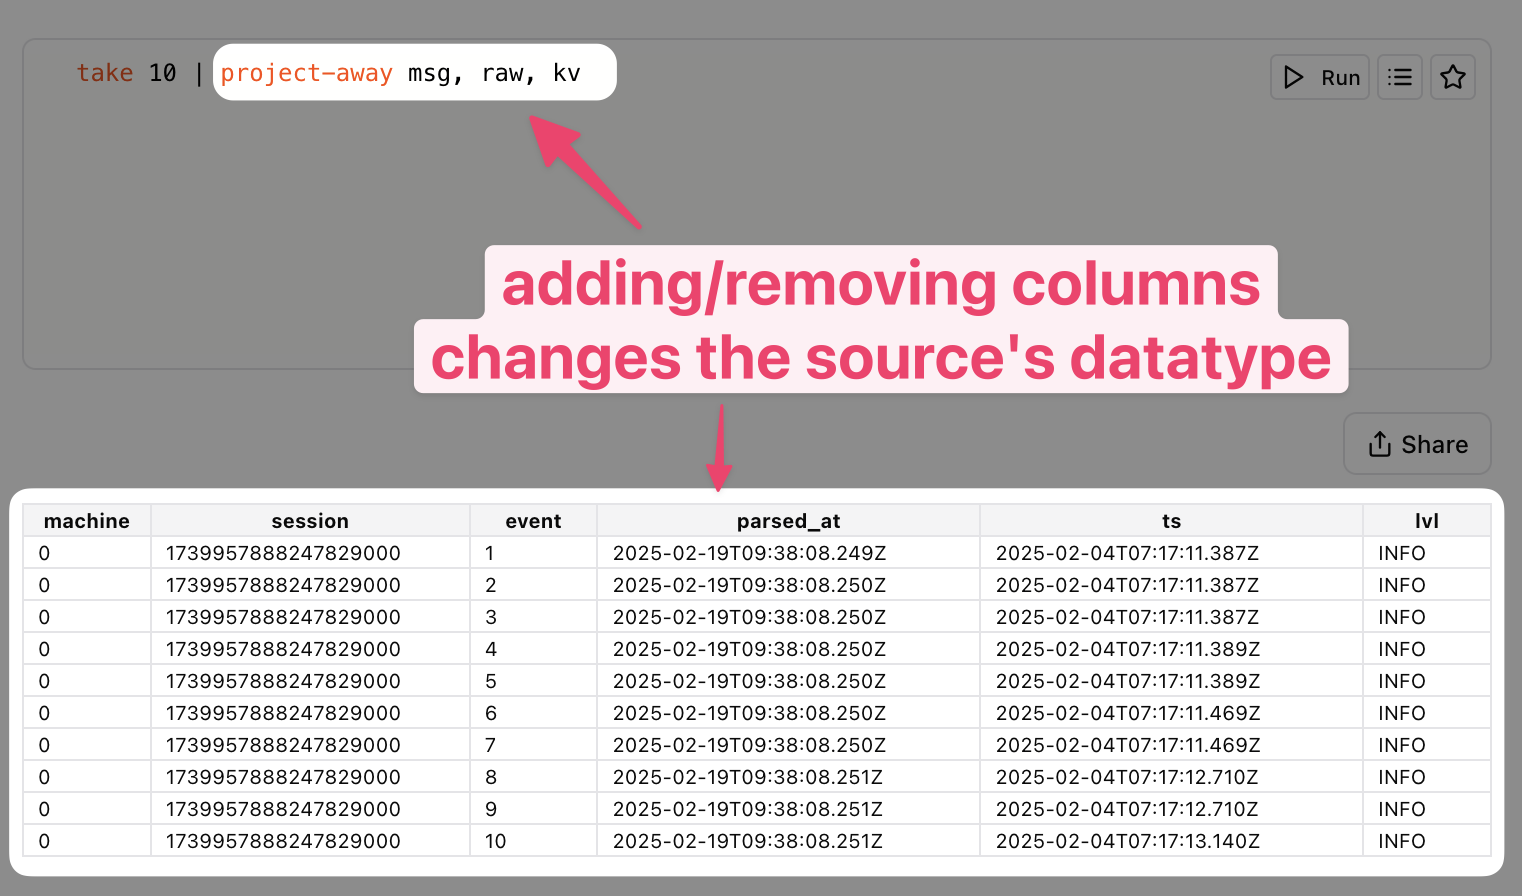
When a query changes the datatype of a logs or traces source, by changing the columns of the input data, the query engine will automatically switch to table mode. In this mode, the query engine will display the results in a tabular format, with each row representing a distinct value for the specified columns.
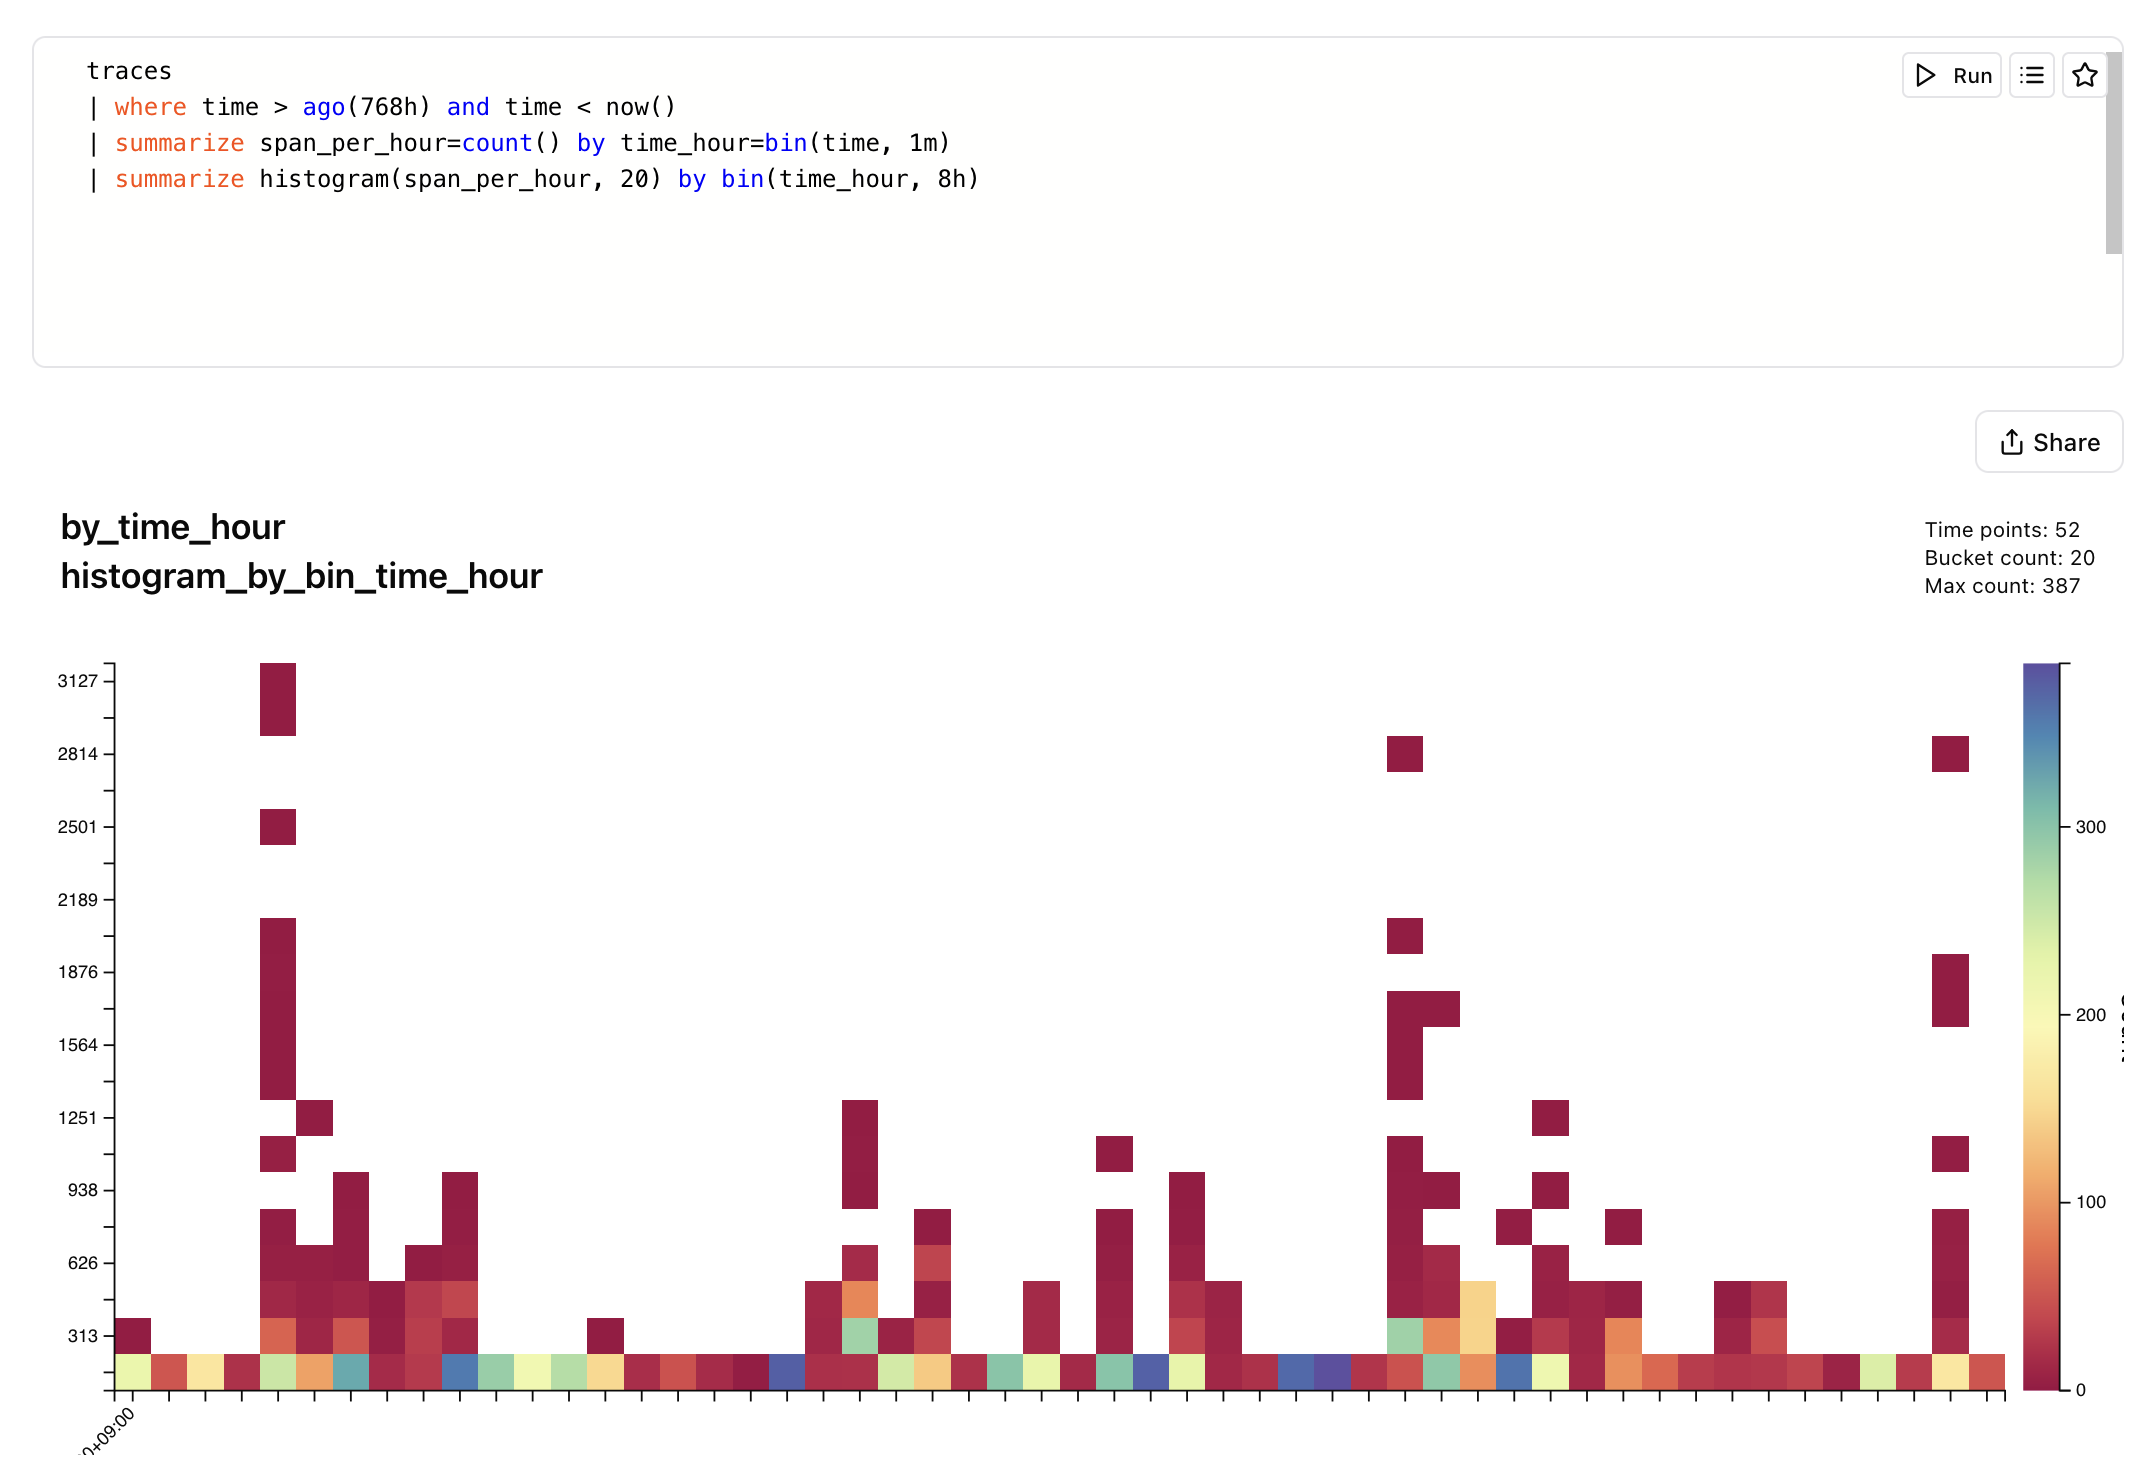
Depending on the shape of the data of the table, some special render modes will be activated. For example, if the table has a timestamp column as the first column and a histogram column as the second column, the query engine will automatically switch to heatmap mode.
Sharing Your Results
Once you've found something you like, click on the share button to start sharing your results.
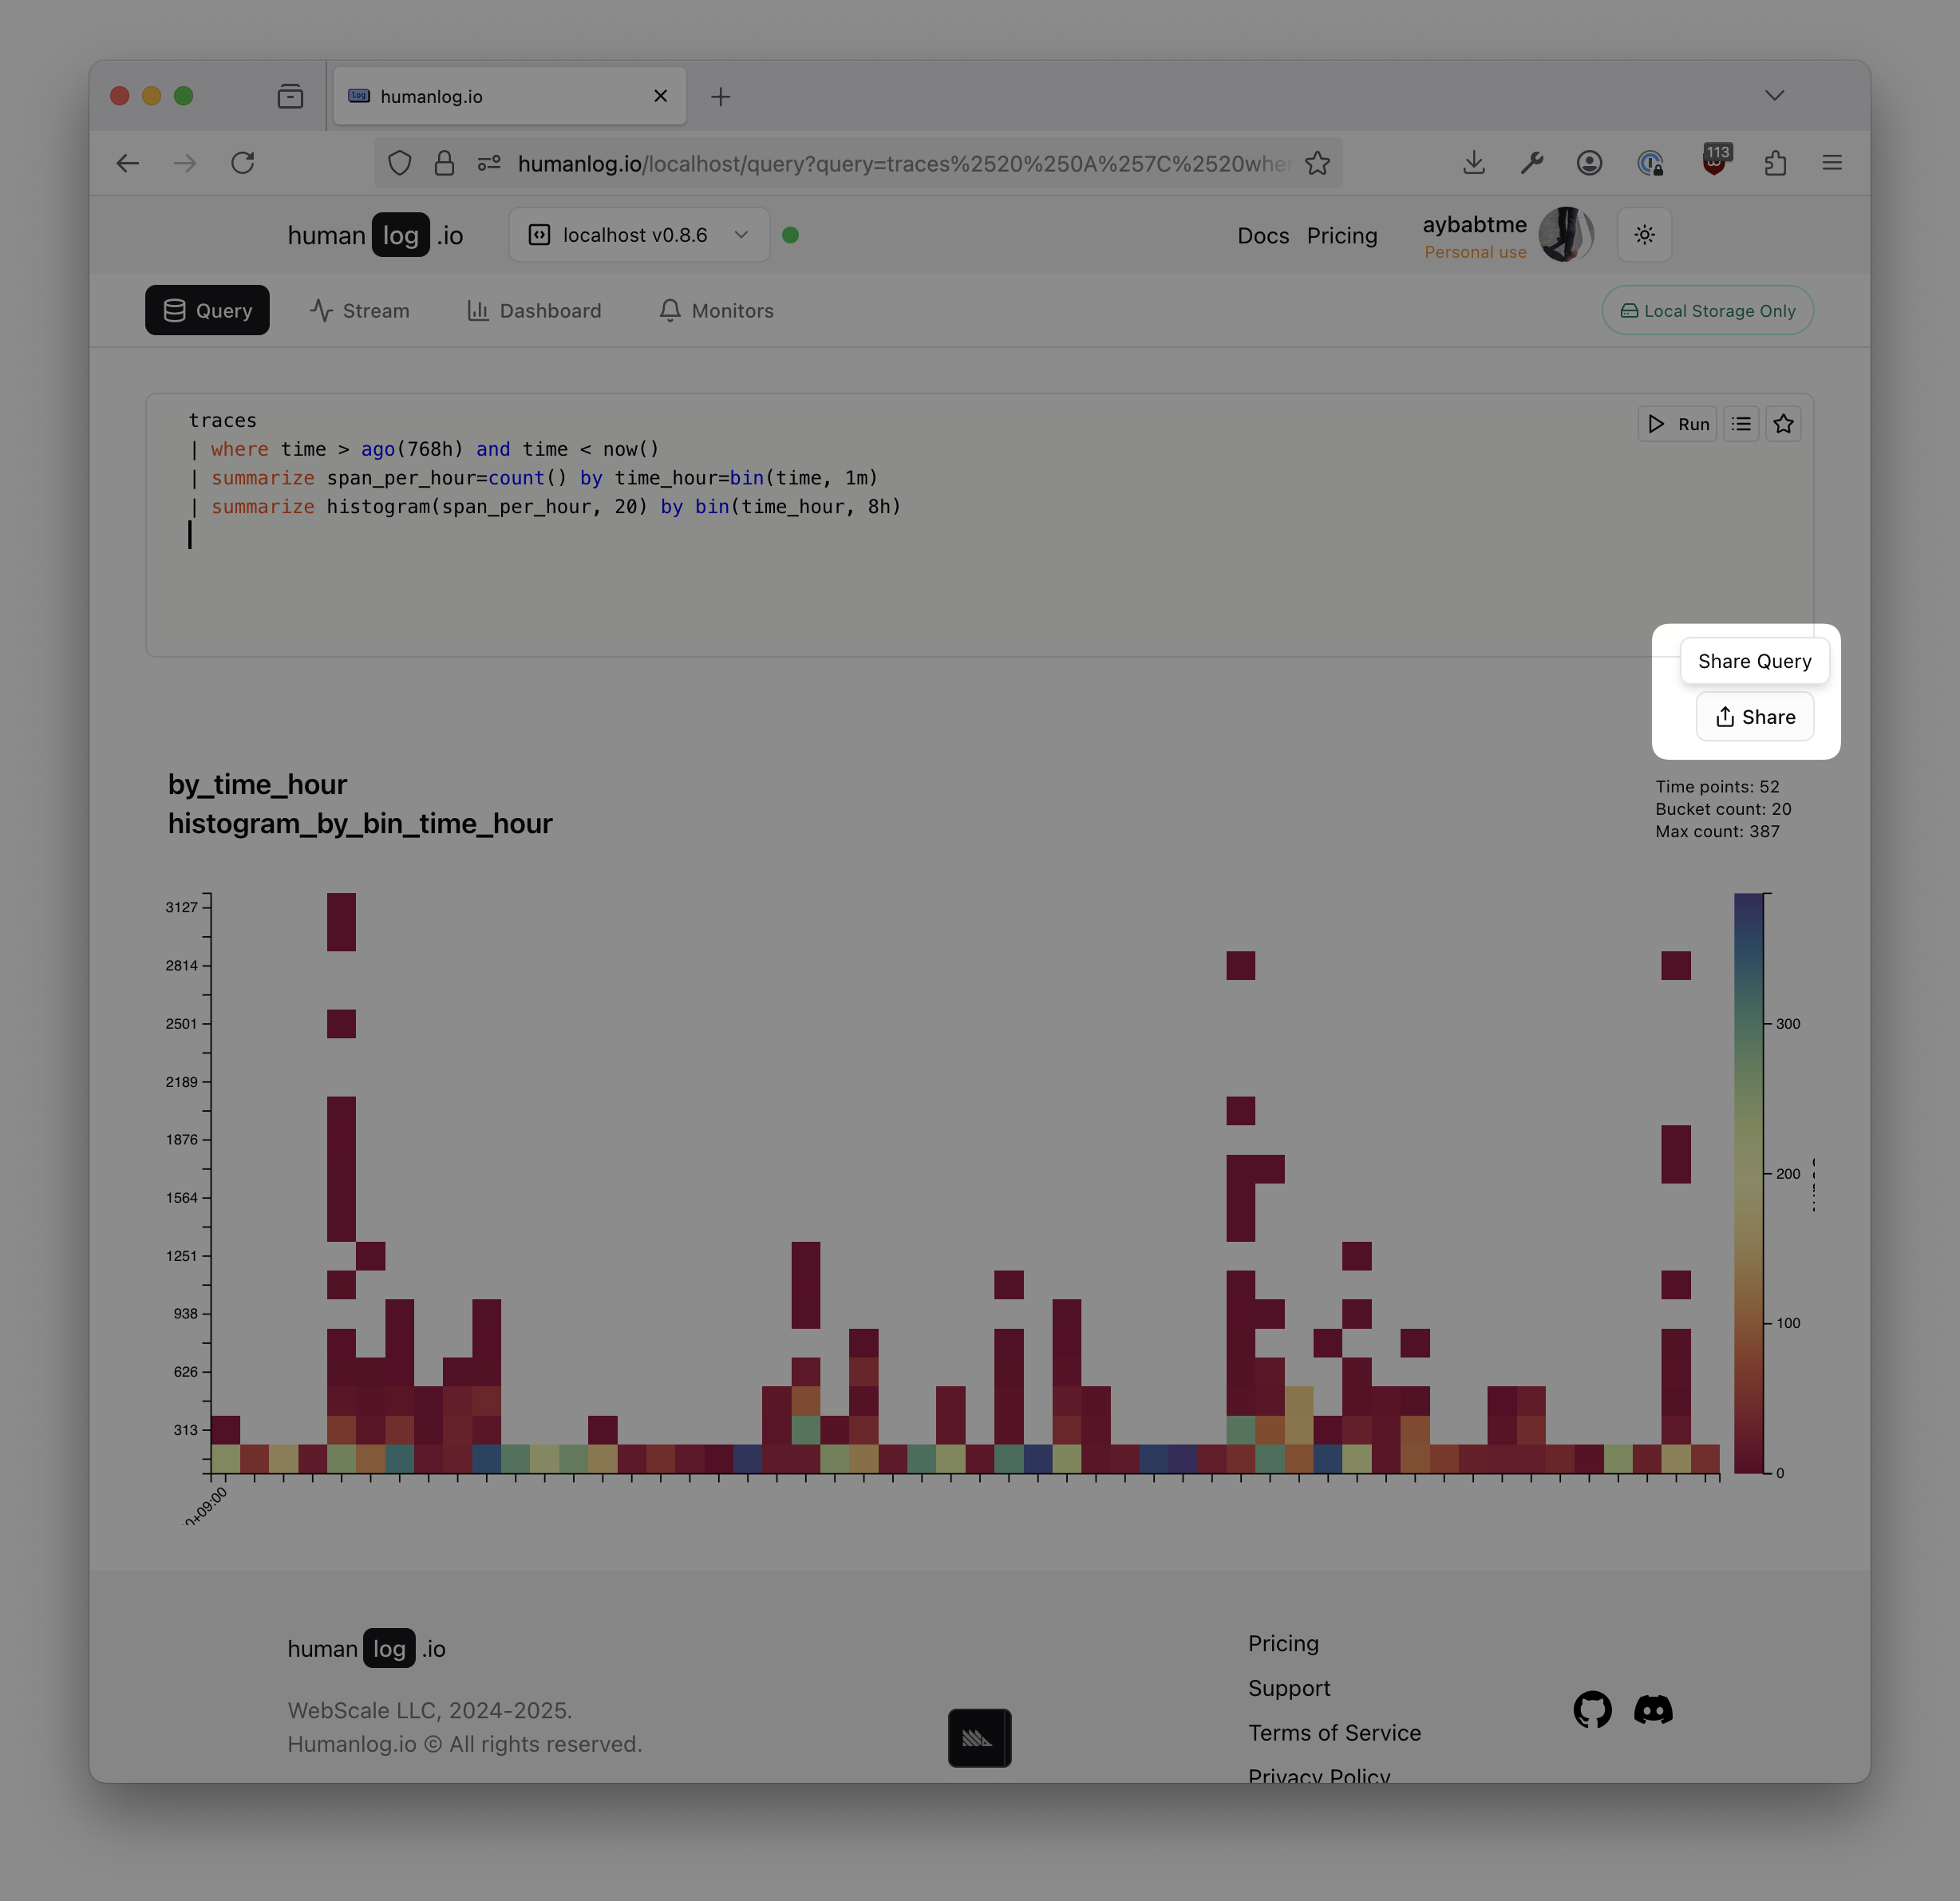
Clicking on the share button will open a modal where you can select the visibility of your shared results.
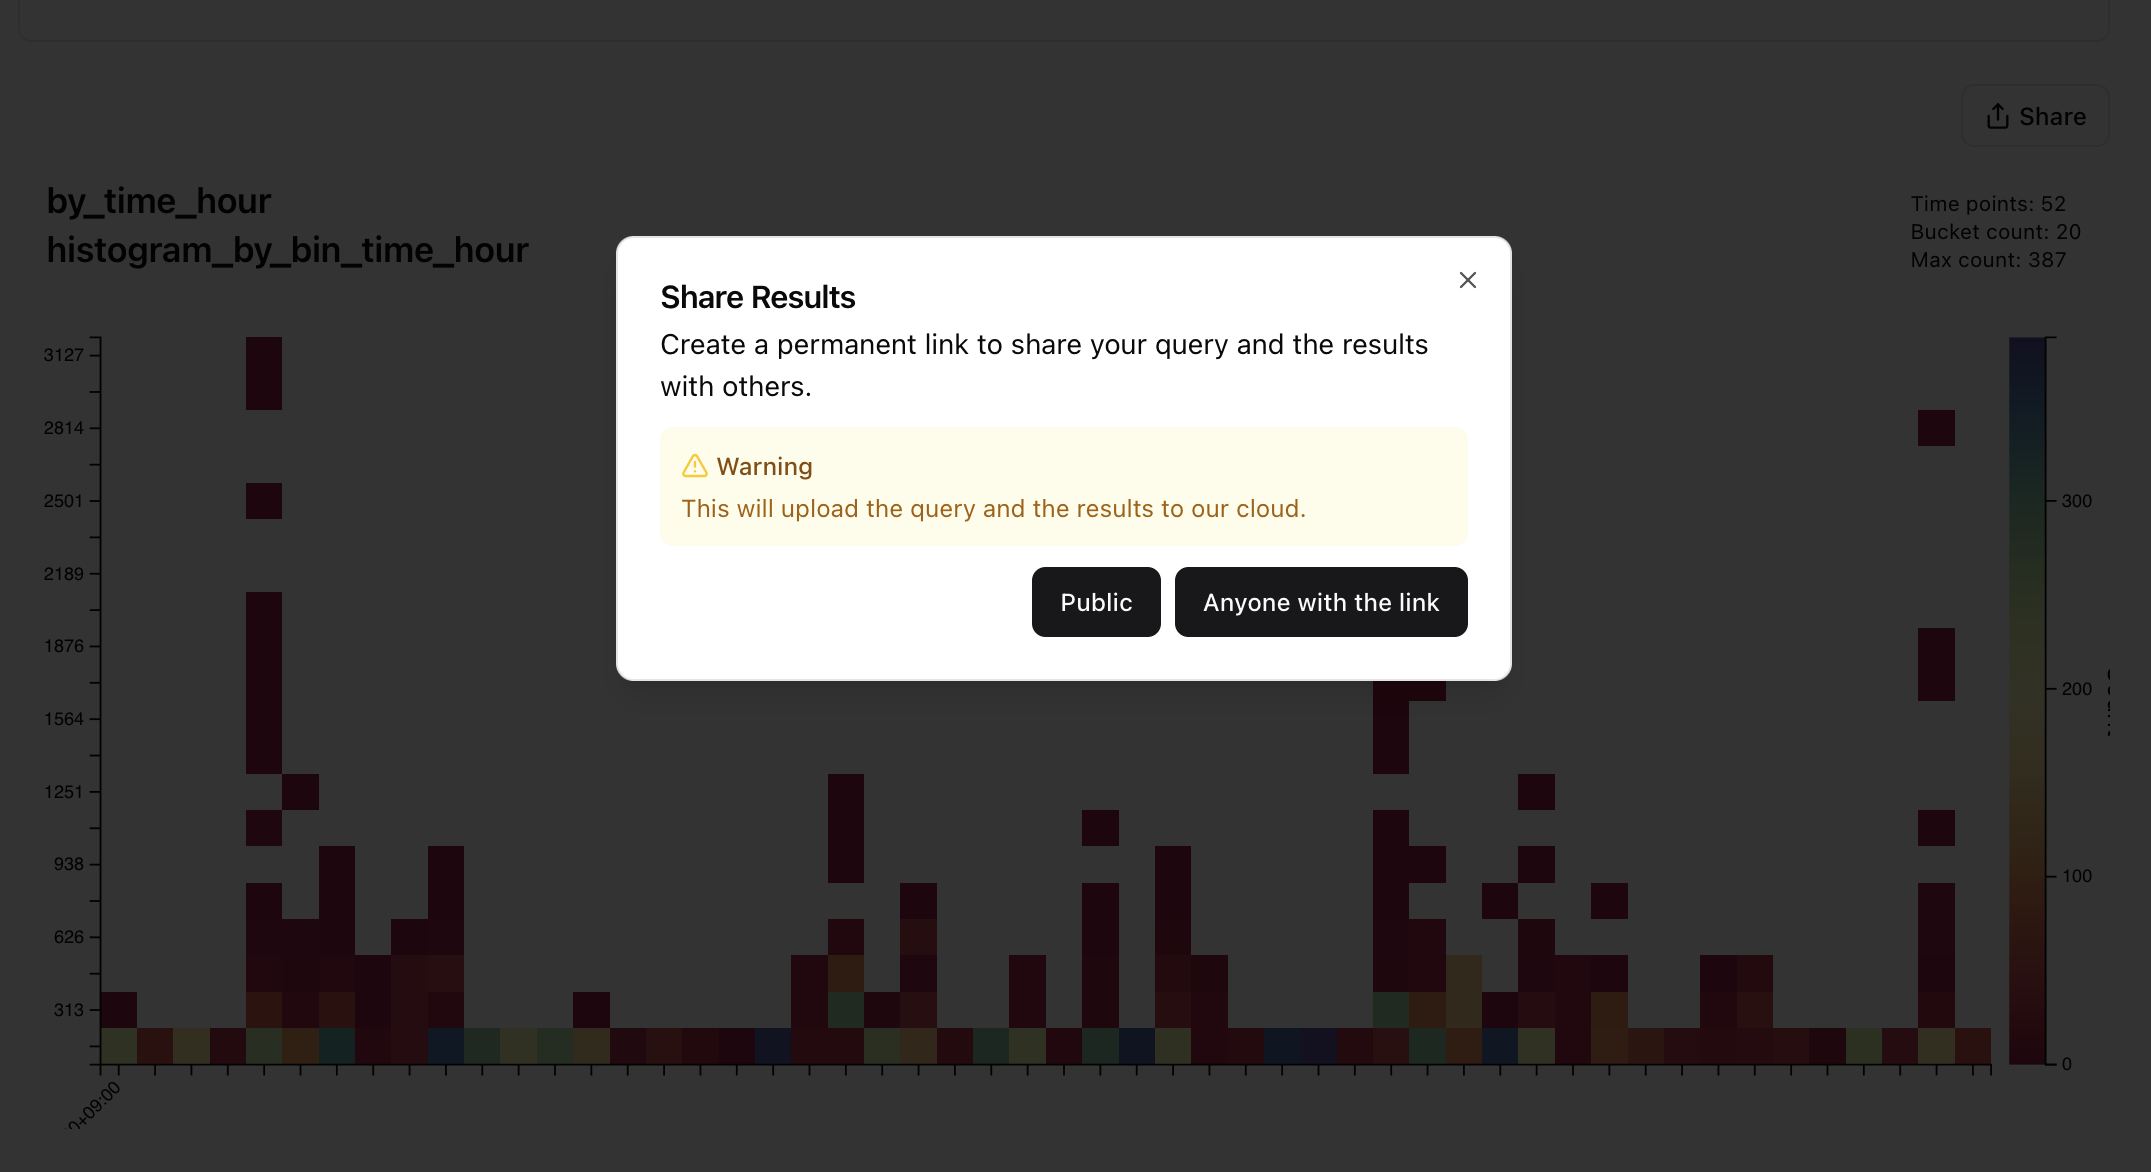
A publicly shared result will be visible on your /u/{username} page, while a result shared with "anyone with the link" will be visible to anyone with the link, but not be visible on your profile page. The visibility settings here work exactly the same as GitHub Gists: public Gist are visible on your profile page, while private Gists are not. But in both cases, anyone with the link can see the result.
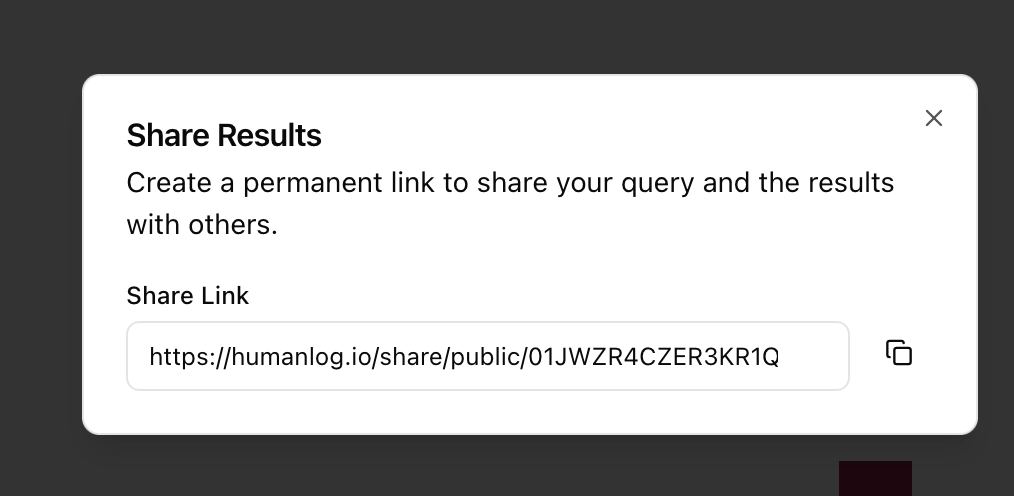
Clicking on either option will produce a link that you can share.
Clicking on the link will open a page that shows your query and the associated results. This page is public and anyone with the link can see it.
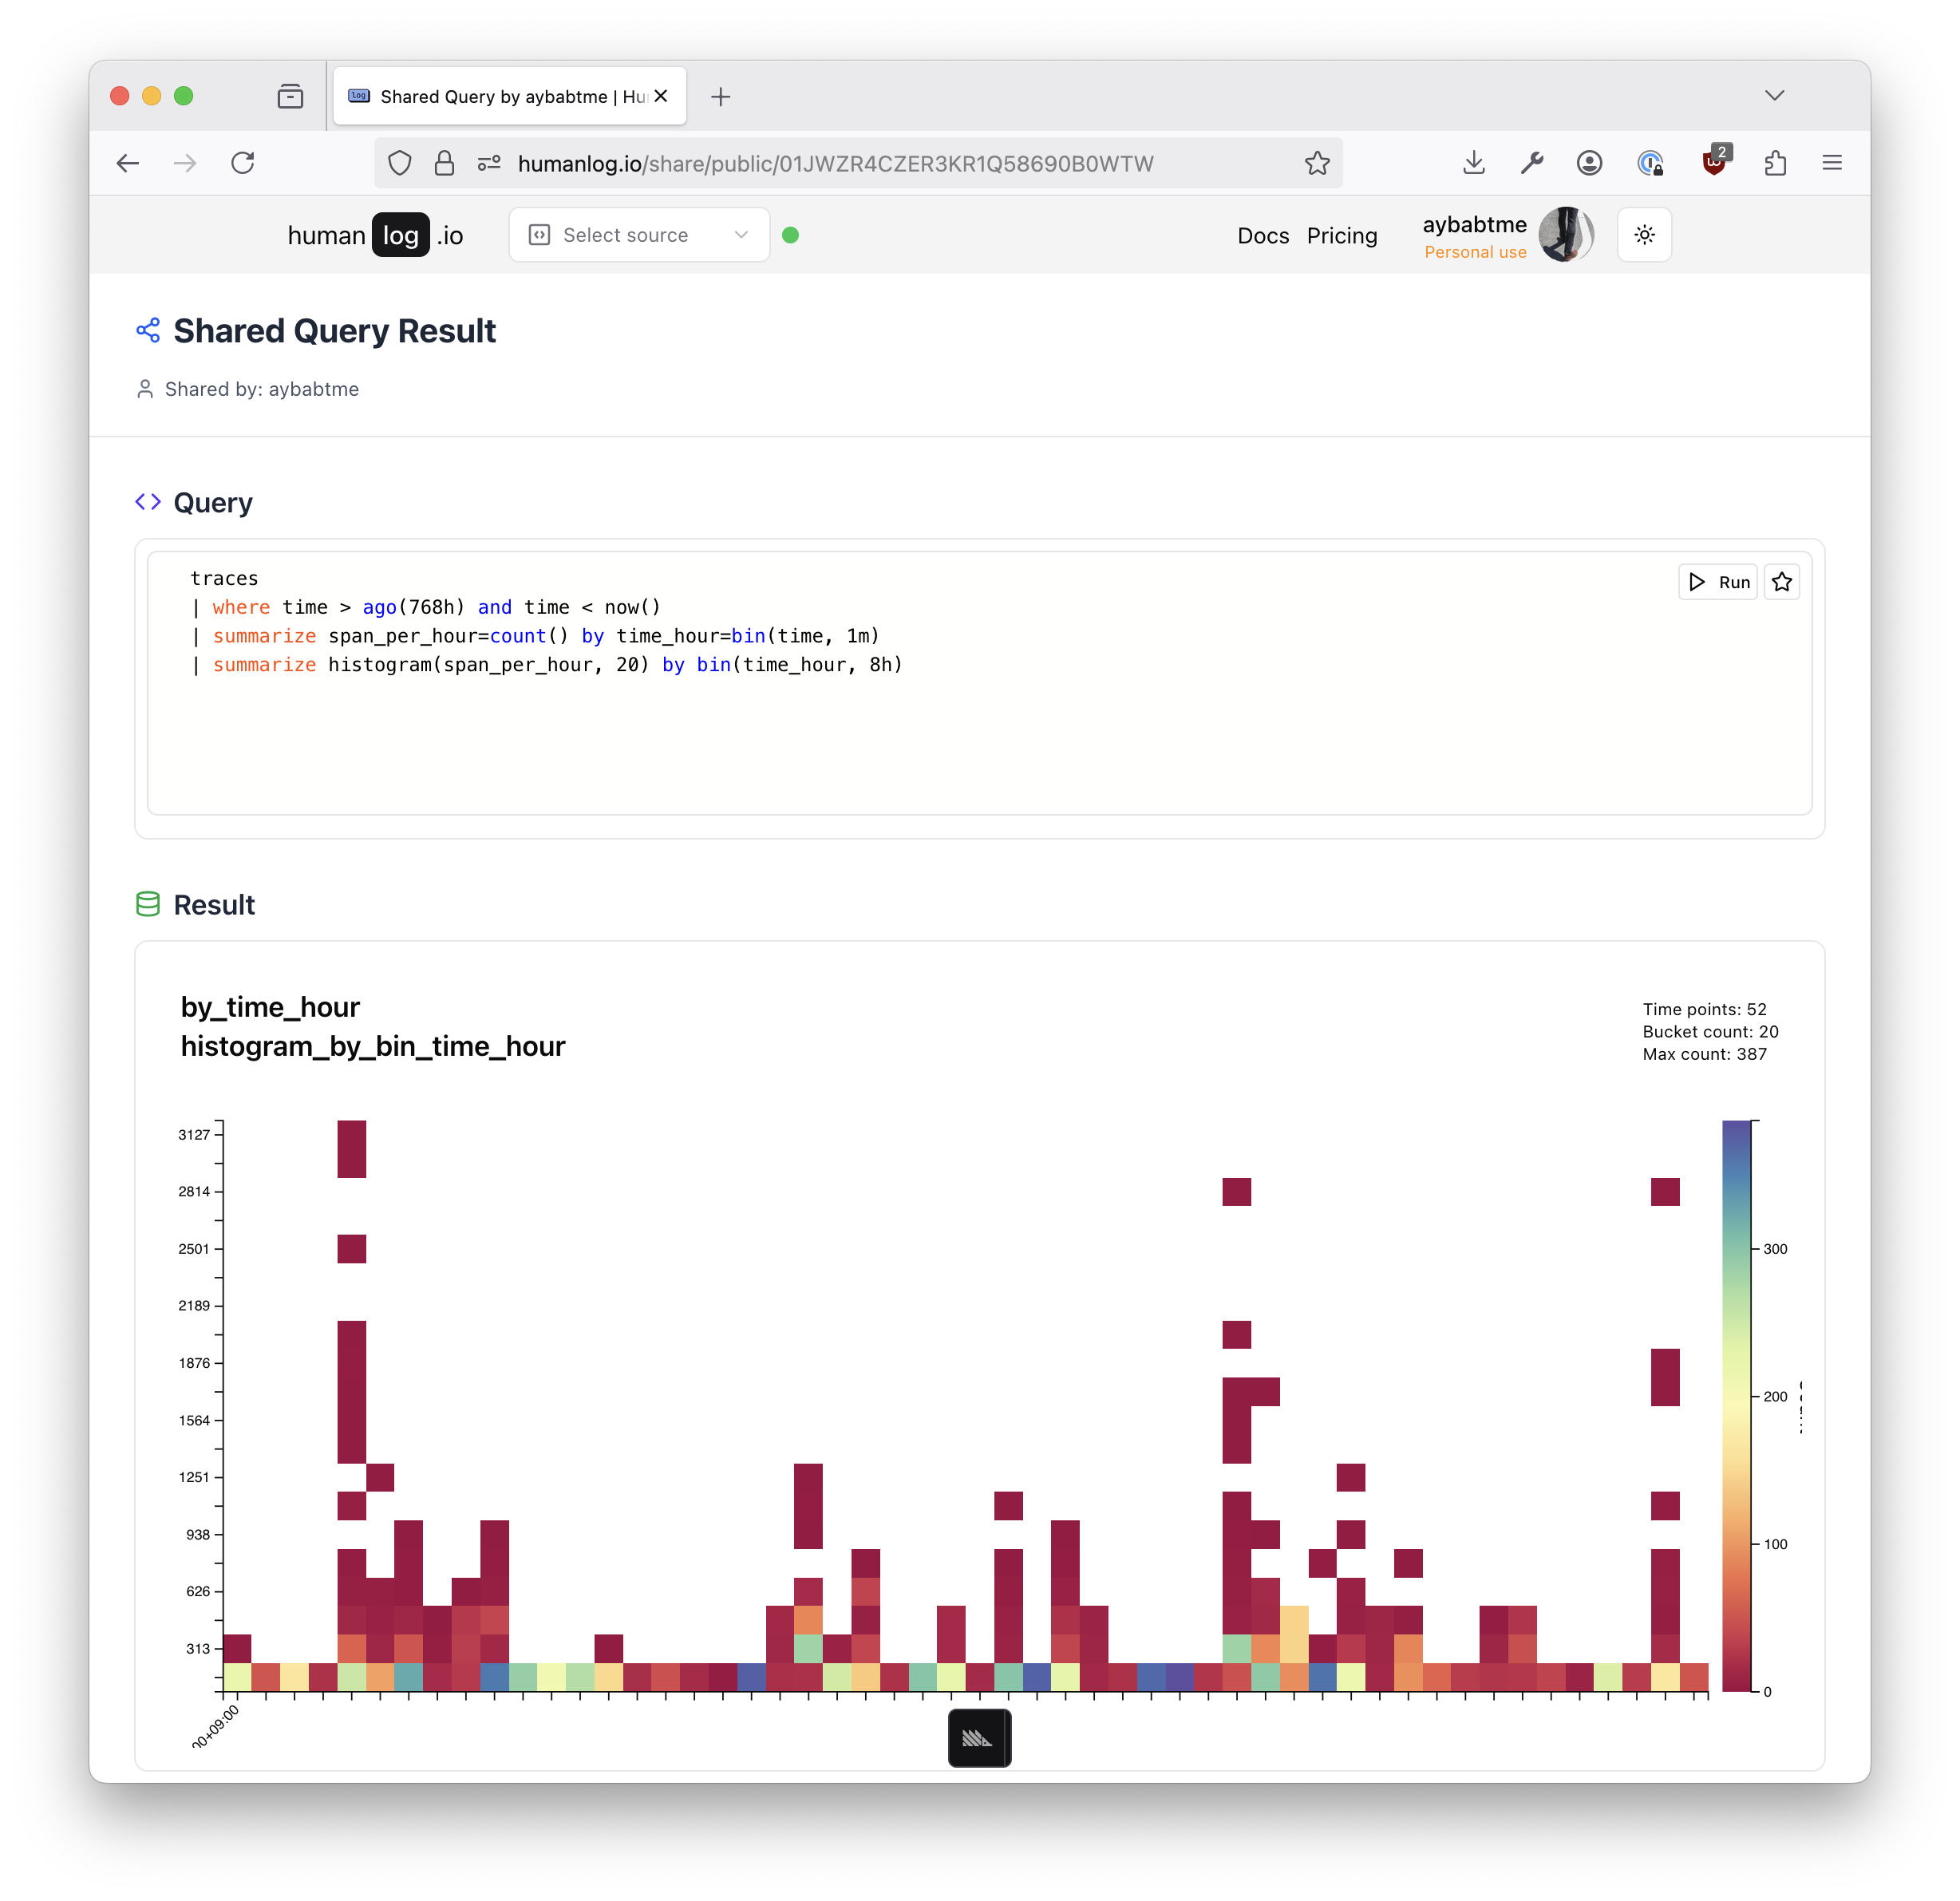
Learn more about it in the sharing section.
FAQ
Any questions that haven't been answered will be added here. Join our community channels to ask any questions you may have about the query page.
What's Next?
- 🌊 How to stream →
- 📚 Query language reference →
- 📤 Share your findings →
- 📊 Structured logging →
- 🔐 Localhost concepts →
Need help or want to give feedback? Join our community channels.